Kubby user guide
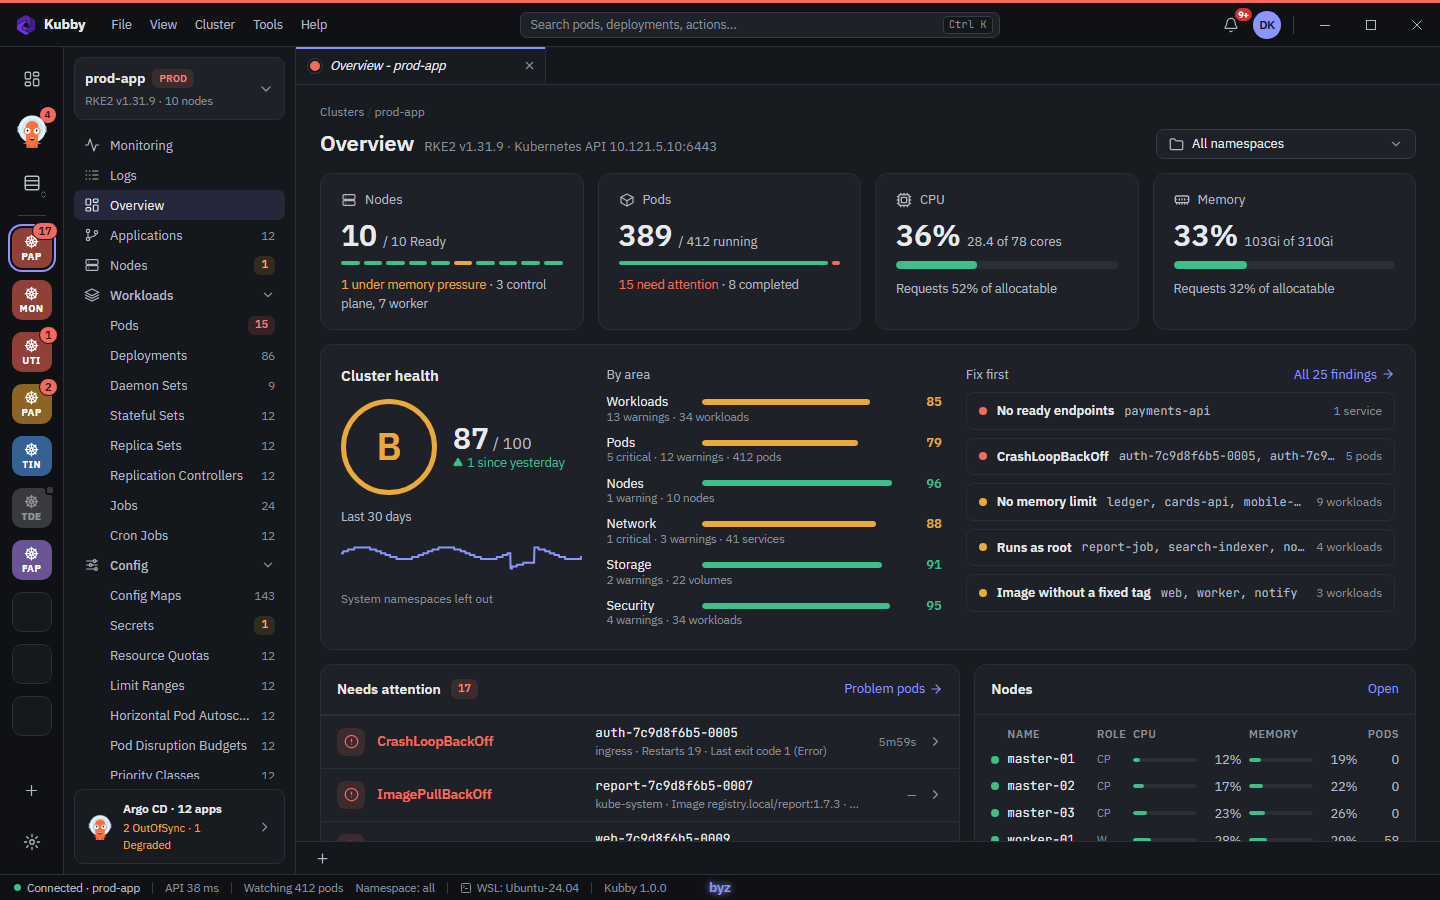
Kubby is a free desktop Kubernetes manager for Windows. This guide covers Kubby 1.0. Each section shows a screenshot first, then the steps.
Contents
- Getting started
- Everyday use
- Making changes
- Integrations
- Troubleshooting guides
- Account and settings
- Updates and help
About commands in this guide
Each command block says where to run it: PowerShell or WSL bash. kubectl commands also work in Kubby's own terminal, which already points at the open cluster. Replace <pod>, <ns> and similar placeholders with your values.
1. Getting started
1.1 Introduction
Kubby runs on your computer and connects to your clusters directly, with your kubeconfig files. Nothing is installed in the cluster and cluster data is never sent to any server.
- Kubby can do exactly what the Kubernetes API allows your account to do, nothing more.
- Lists update live (Kubernetes watch API). You never need to refresh.
| Goal | Where |
|---|---|
| See problems | On top of Overview, Pods and Nodes. |
| Understand why | Logs, events, describe, Why is it restarting?. |
| Change safely | YAML with a diff, scaling, restarts, PROD protection. |
| Monitor | Prometheus dashboards, capacity, certificates. |
| GitOps and Helm | Argo CD applications; Helm releases, upgrade and rollback. |
Quick start:
- Install Kubby (1.2).
- Create your local Kubby account.
- Add a cluster (1.3).
- Open Overview: what needs attention is on top.
1.2 Installation and first start
Kubby is free. It ships as one setup exe, Kubby_<version>_x64-setup.exe, on the download page of kubby.tech, and installs without administrator rights. The wizard is in English, or in Turkish on a Turkish Windows.
Install
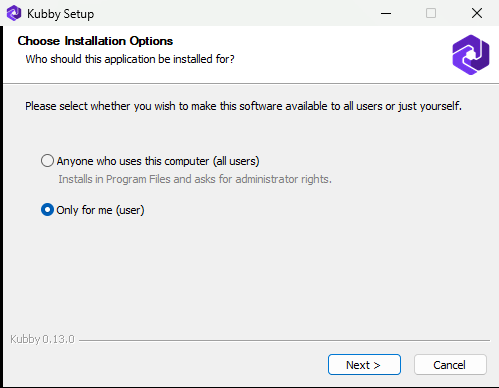
- Run the setup exe. If Windows shows Windows protected your PC (the exe is not code-signed yet), click More info, check that it is the Kubby setup, then Run anyway. If company policy blocks unsigned installers, ask IT to allow the file by its SHA-256 hash (on the download page).
- Choose who gets Kubby, then Next:
- Only for me (default):
%LOCALAPPDATA%\Programs\Kubby, no administrator rights. - Anyone who uses this computer (all users):
C:\Program Files\Kubby. Windows asks for administrator rights; if you decline, choose Only for me.
- Only for me (default):
- If Kubby is already installed, an Already Installed page asks whether to uninstall first or install over it. Kubby keeps its current folder.
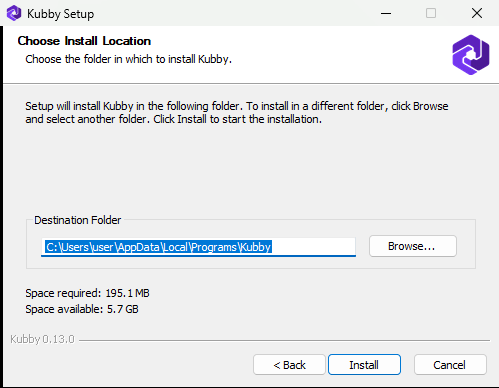
- Keep the folder or click Browse…, then Install.
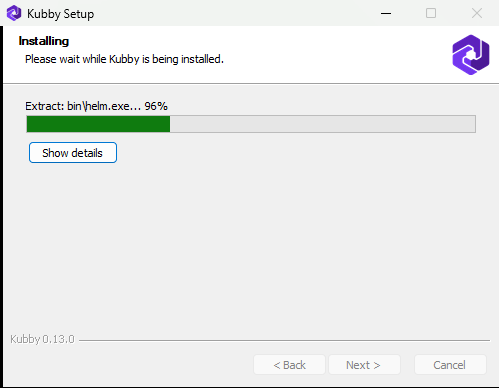
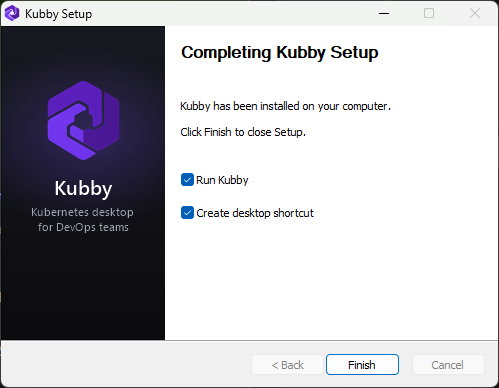
- Leave Run Kubby and Create desktop shortcut checked if you want them, then click Finish.
To uninstall: Windows Settings → Apps → Installed apps → Kubby → … → Uninstall. An all-users install asks for administrator rights.
Starting and closing
- Closing the window (×) keeps Kubby running in the notification area next to the clock, like Lens. Click its icon to open Kubby again.
- To quit, use File → Exit, or right-click the icon → Quit Kubby.
- To start Kubby when you sign in to Windows: Preferences → App → Start-up.
First start: create your account
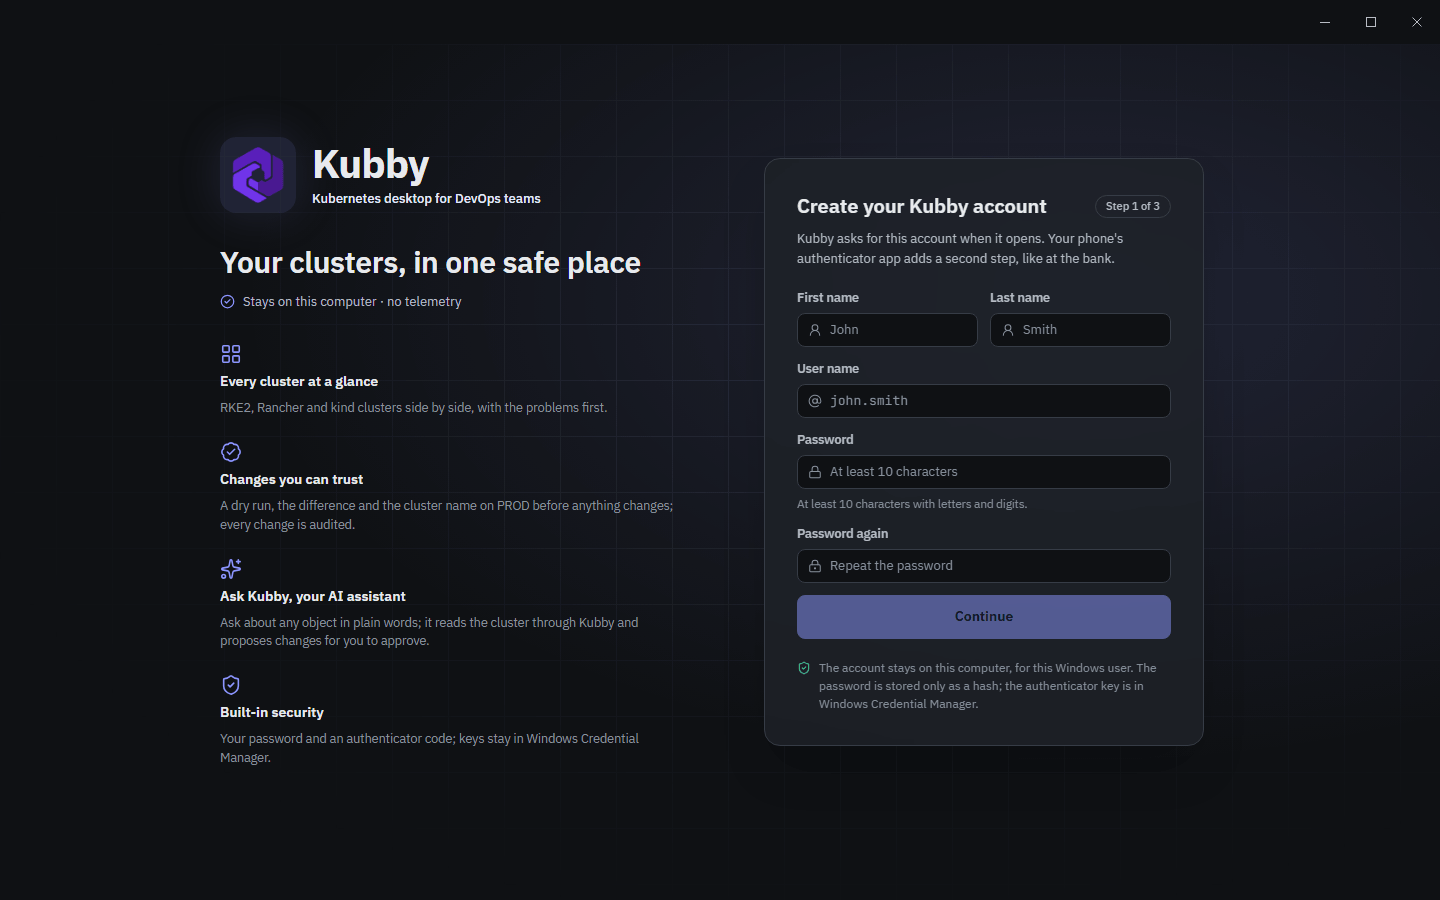
- Create your Kubby account: enter First name, Last name, User name, Password and Password again.
- Scan with your authenticator app: scan the QR code with Microsoft Authenticator, Google Authenticator or similar (the entry is named Kubby), then type the 6-digit code into Code from the app.
- Save your recovery codes: 10 single-use codes for when you lose your phone. Keep them somewhere safe.
A sign-in lasts 8 hours. Next: add your first cluster.
1.3 Adding clusters
Kubby connects with kubeconfig files. Each added context is saved as a plain kubeconfig file in %APPDATA%\Kubby\kubeconfigs (like Lens); tokens and passwords are never written to logs.
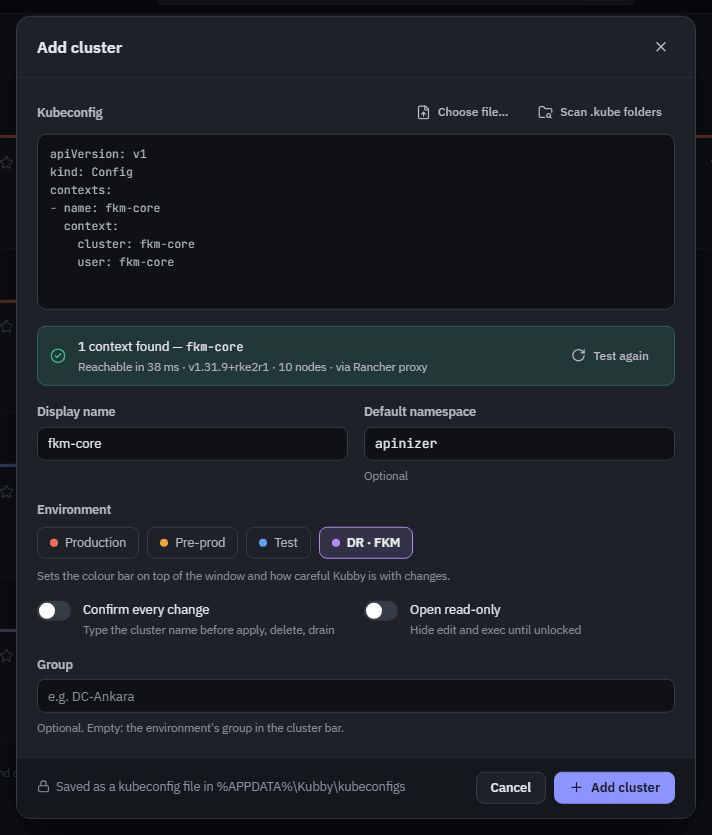
- Click + in the cluster bar, File → Add cluster…, or Add cluster on the Clusters page.
- Paste the kubeconfig, or use Choose file… / Scan .kube folders. If it has several contexts, pick the ones to add.
- Check the test result: Kubernetes version and node count (Test again repeats it).
- Set Display name, an optional Default namespace, the Environment and an optional Group.
- Optional: Confirm every change (type the cluster name before apply, delete, drain) and Open read-only (hide edit and exec until unlocked).
- Click Add cluster.
More ways to add clusters:
- Import from folder on the Clusters page imports every kubeconfig in a folder.
- Preferences → Kubernetes → Manage kubeconfigs keeps files and folders in sync.
Environments: every cluster belongs to one (PROD, PREPROD, TEST or your own). Its colour shows in the strip at the top of the window, in the cluster bar and in labels. In protected environments (PROD by default) every change is confirmed by typing the cluster name (3.2). To add one: Preferences → Cluster bar → Environments → New environment.
Cluster bar and groups
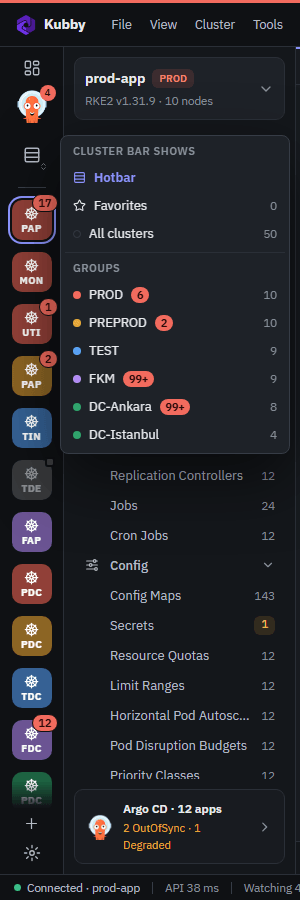
- Click the button above the tiles to choose what the cluster bar shows.
- Drag tiles to reorder or group them. Right-click a tile to change its colour and appearance.
- A red number on a tile is the number of problems in that cluster.
| Shortcut | What it does |
|---|---|
| Ctrl + 1 … 9 | Open cluster 1–9 of the group shown |
| Ctrl + Alt + ↓ / ↑ | Next / previous group |
1.4 Interface tour
The window has five parts. Pages open as tabs; a resource you click opens in a details panel on the right (close it with Esc).
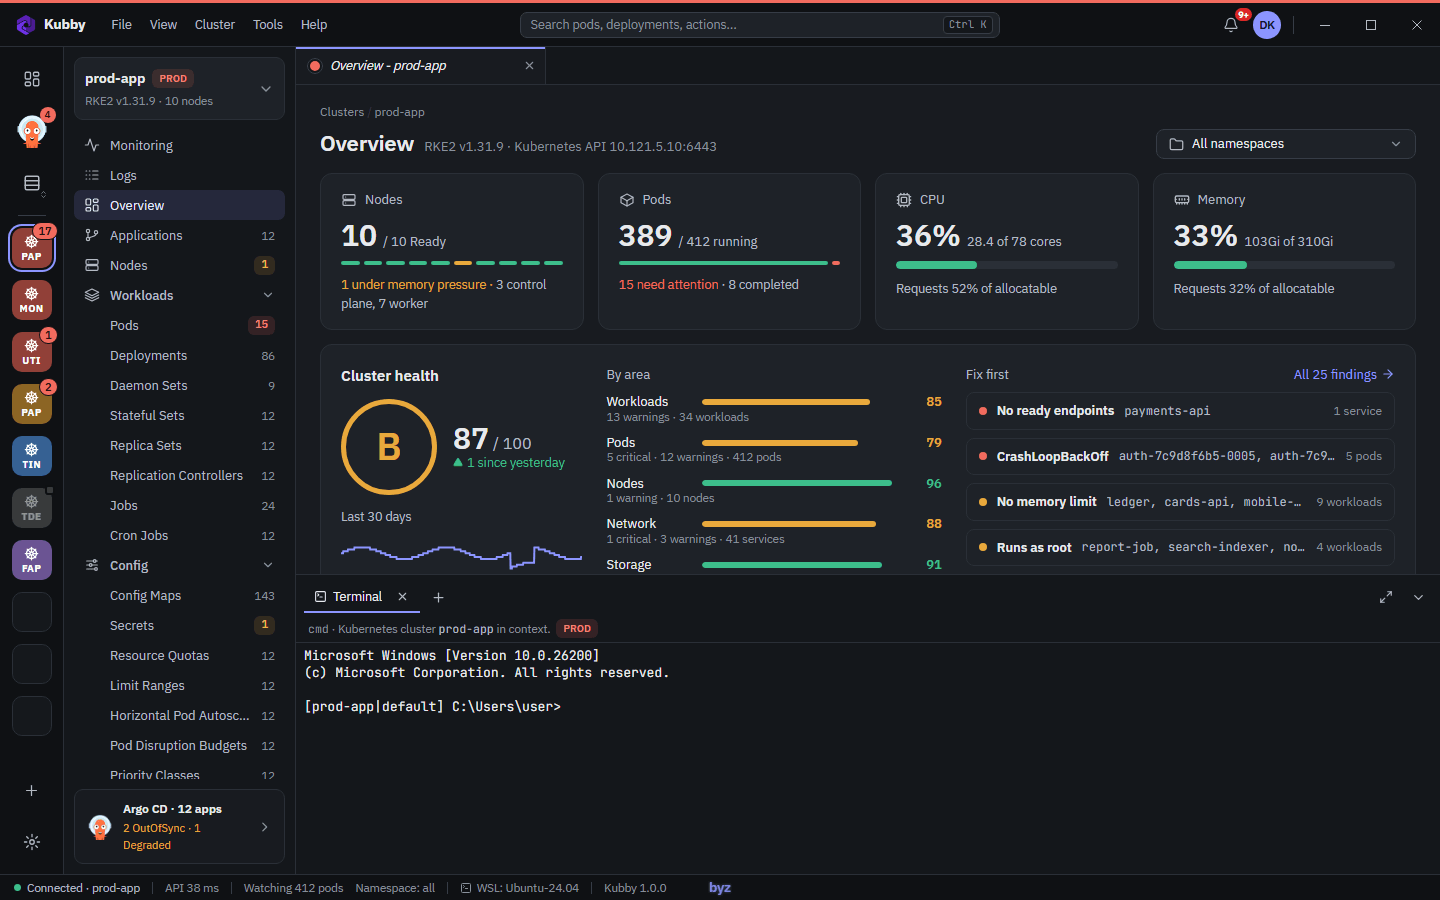
| Part | What it holds |
|---|---|
| Cluster bar (far left) | Your clusters, the Argo CD centre and the Clusters page. |
| Navigator | The open cluster's menu: Monitoring, Logs, Overview, Applications, Nodes and the resource groups. Numbers are counts; coloured numbers are problems. |
| Workspace | The pages, as tabs. Ask Kubby opens in its own panel on the right. |
| Bottom dock | Terminals and the create editor. Resizable, several tabs. |
| Top bar | Menus File, View, Cluster, Tools, Help; search and command palette (Ctrl + K); the notification bell; your profile menu (initials). |
| Status bar | Connection, API latency, watched pods, namespace, WSL distribution and the Kubby version. byz in the middle opens Kubby on GitHub. |
Theme: Kubby starts dark. View → Theme or Preferences → App switches to light, or to System (follows Windows).
2. Everyday use
2.1 Overview and problems
Overview sums up the open cluster: nodes, pods, CPU and memory, the health card (2.2) and Needs attention.
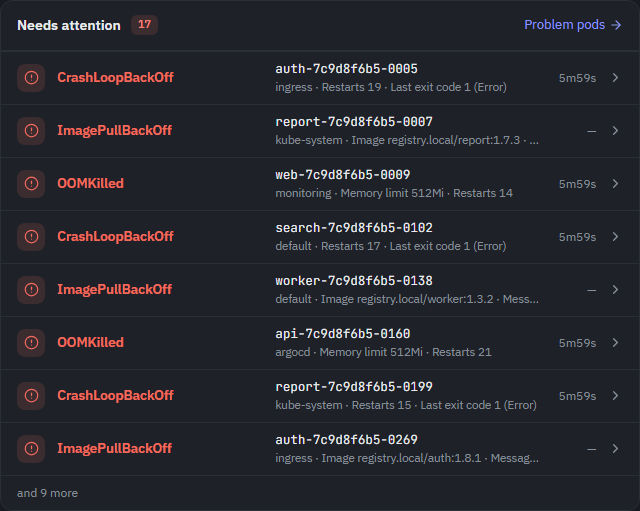
- Kubby recognises CrashLoopBackOff, ImagePullBackOff, OOMKilled, pods that cannot be placed (Pending, Unschedulable), failed Jobs, workloads that are not ready, and TLS certificates in Secrets that expire soon or have expired.
- Click a row to open the resource. Problem pods opens the pod list with the problems.
- The namespace picker (top right) selects one or more namespaces. Kubby remembers it per cluster.
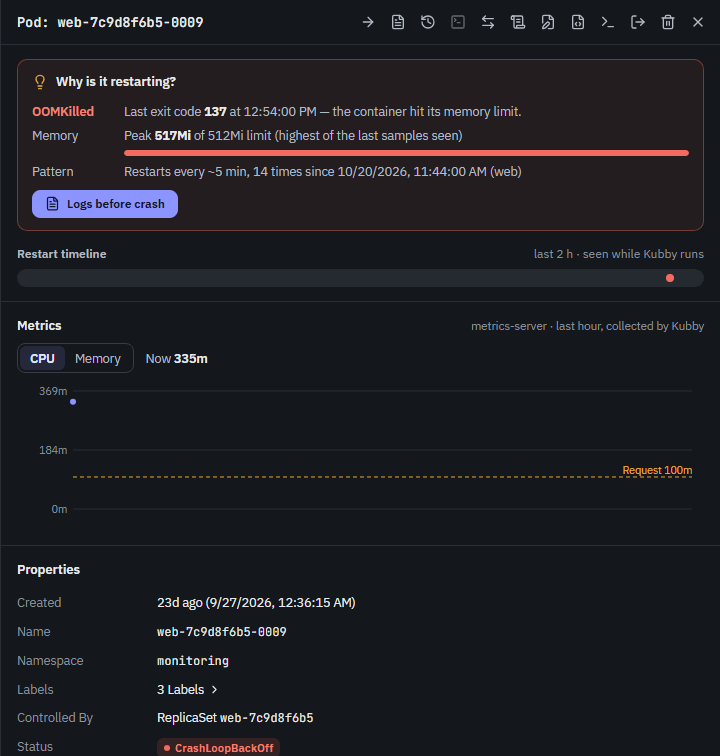
On a restarting pod, Why is it restarting? shows the last exit code and reason, for OOMKilled the memory limit and the highest usage seen, the restart pattern, and Logs before crash.
2.2 Cluster health score
Every cluster gets a grade from A to F and a score out of 100. The Cluster health card on Overview shows it.
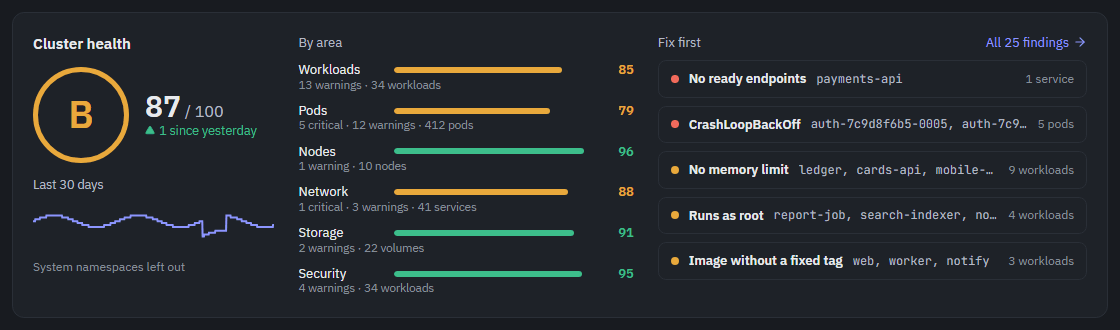
- Grade: A from 90, B from 80, C from 70, D from 60, E from 50, then F.
- Last 30 days: Kubby records the score every hour while it watches the cluster.
- By area: workloads, pods, nodes, network, storage, security, with critical and warning counts.
- Fix first: the five groups of findings that cost the most. All N findings opens the Cluster health page.
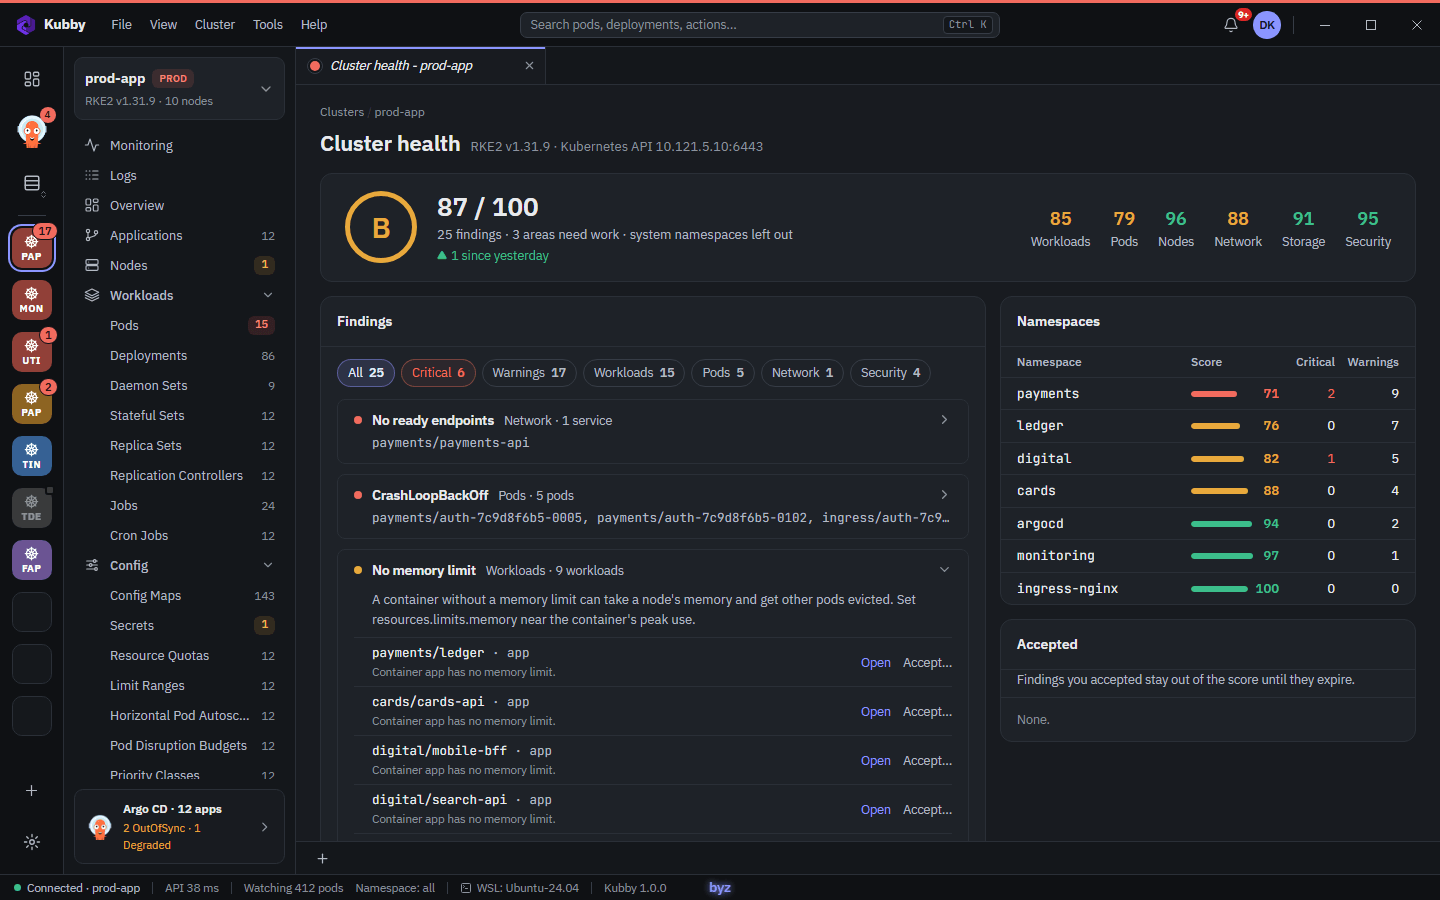
Each finding has Open and Accept…. Accept… leaves it out of the score for the object, its namespace or the whole cluster. A reason is required, an end date is optional; accepting and undoing both go to the audit log.
| Area | What Kubby checks |
|---|---|
| Resources | Containers without a memory limit or without requests. |
| Images | No fixed tag (:latest); registries outside your allowed list. |
| Probes | No readiness or liveness probe. |
| Security | Privileged containers, containers that (may) run as root, host network, PID or paths. |
| References | ConfigMaps, Secrets and service accounts that a workload needs but that do not exist. Kubby reads only their names. |
| Workloads | No ready pod, fewer ready pods than wanted, scaled to zero. |
| Services | No pods selected, no ready endpoints, or a port the pods do not expose. |
| Disruption budgets | PDBs that select no pods or block drains; workloads without a PDB. |
| Nodes | Cordoned nodes. |
How the score is counted: every object counts once per area at its worst finding (critical 0, warning 0.6, none 1). Areas are weighted: workloads 25, pods 25, nodes 15, network 15, storage 10, security 10. Areas without objects are left out; an area you cannot read shows Not checked.
Preferences → Cluster health sets the namespaces left out (default: kube-system, kube-public, kube-node-lease, cattle-*, fleet-*, cis-operator-system, local-path-storage; a trailing * matches a prefix) and the allowed registries, for example harbor.bank.local (empty: all allowed).
2.3 Resource lists and details
Pick a resource kind in the navigator to open its live list. Click a row to open its details on the right.
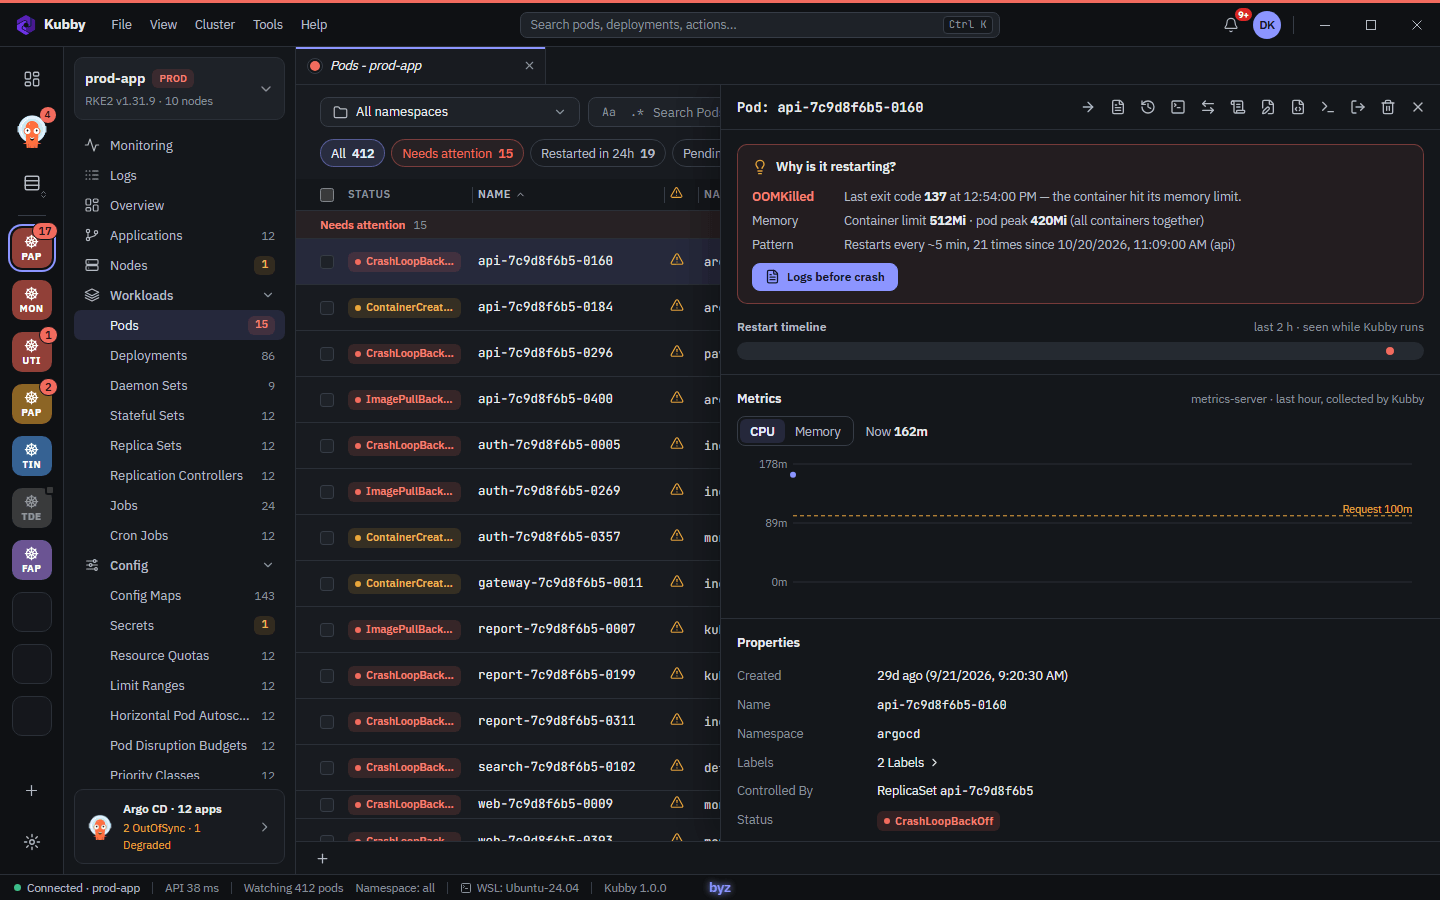
- Problems stay on top under Needs attention. Pods have quick filters: All, Needs attention, Restarted in 24h, Pending, Completed.
- Search (match case, regular expression), sort by a column header, drag header edges or headers, add or remove columns with the columns button. Kubby remembers your choices.
- Select rows with the checkboxes for bulk actions. Export the list as CSV.
- Details tabs: Overview (properties, conditions, metrics), Edit YAML, Describe, Events, Related, and Logs or Rollout history by kind. The icon toolbar on top holds the actions.
- Metrics (with metrics-server): CPU and memory of the last hour with request and limit lines.
- Related: owners and dependencies, for example Deployment → ReplicaSet → Pod, Ingress → Service. An Ingress address opens in the browser.
- Custom Resources: every CRD, by group, listed and edited like built-in kinds.
2.4 Logs and events
A pod's Logs tab shows its logs live, or the previous (crashed) run.
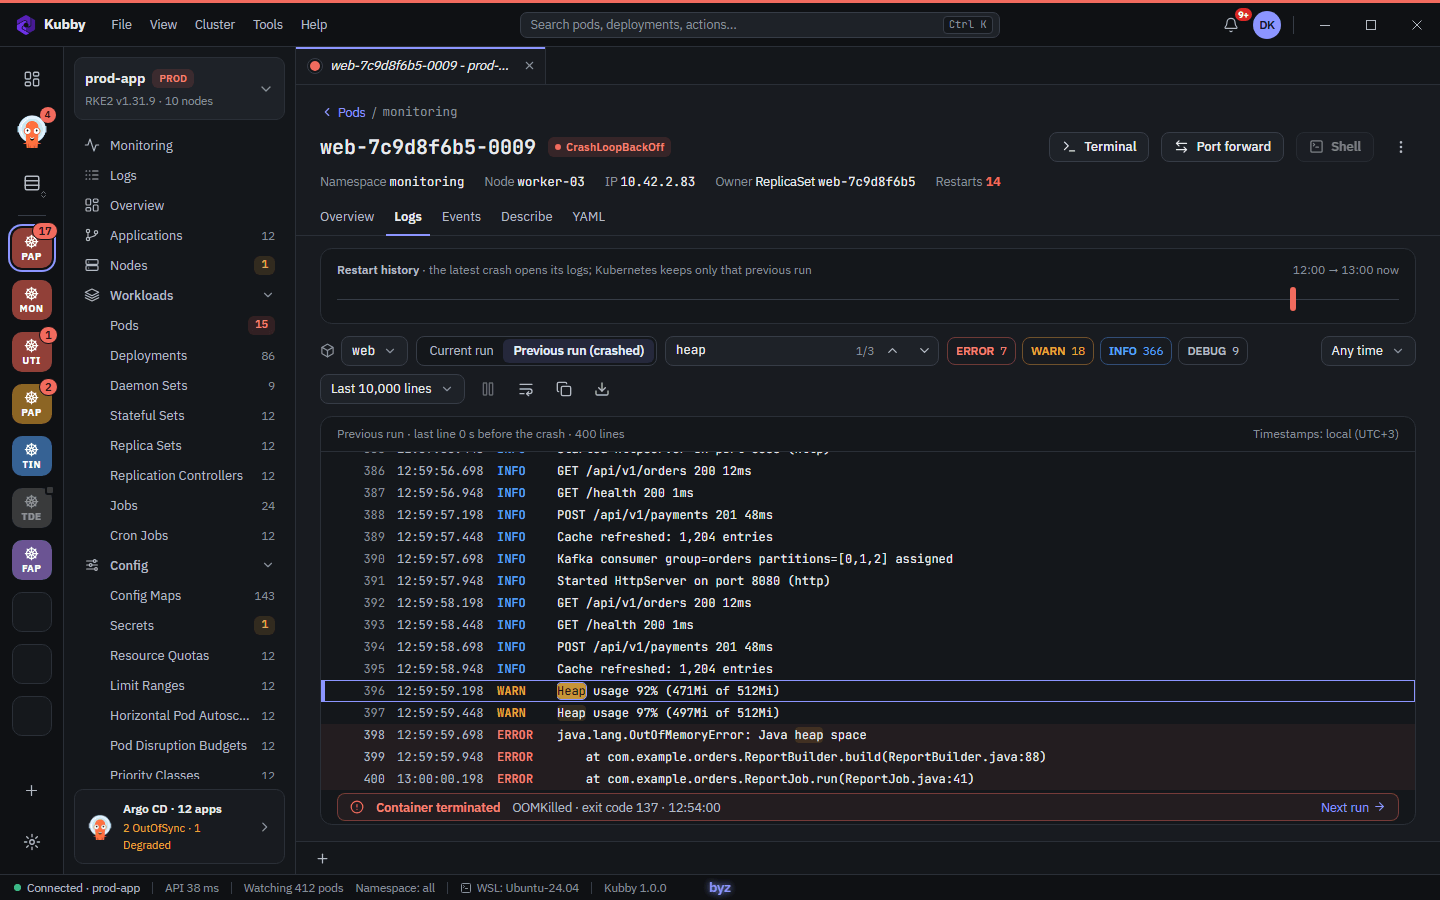
- Container: pick one in multi-container pods.
- Current run / Previous run: after the last line Kubby shows how the container ended (for example OOMKilled, exit code 137).
- Restart history on a timeline; Search with a counter ("3/12"); level filters ERROR, WARN, INFO, DEBUG.
- Time range and line count (for example Last 10,000 lines); times in your time zone; copy or download.
- Workload logs: every pod of a Deployment or StatefulSet in one stream, each line marked with its pod.
- Events: the Events page lists the cluster's events, Warnings first. Every resource also has an Events tab.
- Describe:
kubectl describeoutput with search and copy (5.1 shows one).
2.5 Logs page
The Logs page merges the logs of every pod and container you pick into one live timeline, with pod starts, kills and events between the lines.
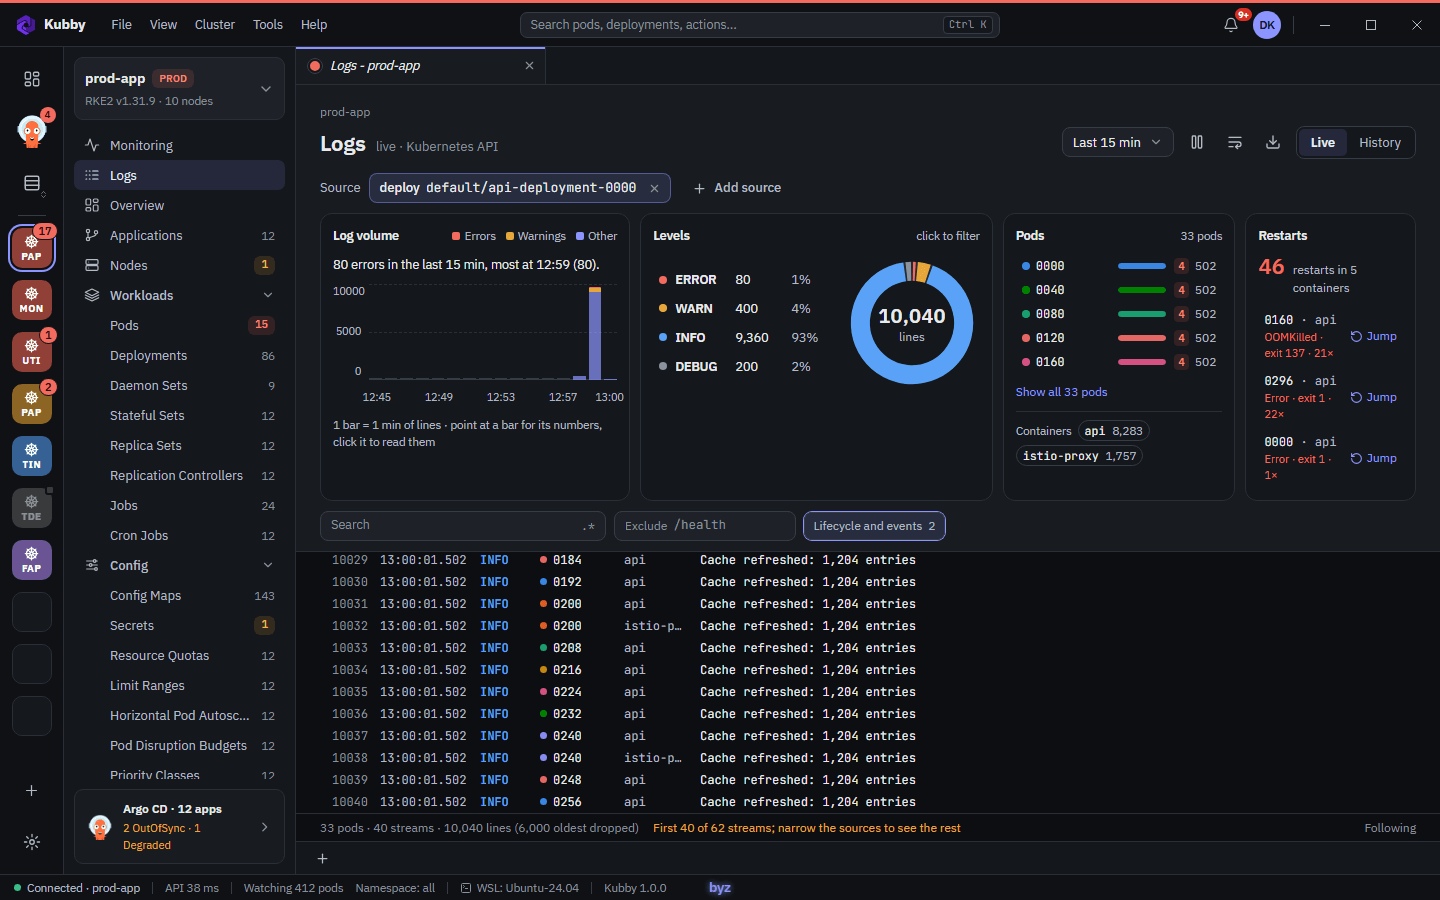
- Open Logs in the navigator (or from a workload's right-click menu, its Logs action, or the palette).
- Click Add source: a workload (Deployment, StatefulSet, DaemonSet, CronJob), a label selector such as
app.kubernetes.io/part-of=gateway, a namespace or a pod. - Use the cards: Log volume (click a bar to read that minute), Levels (click to filter), Pods (click to hide one), Restarts (Jump to a crash).
- Filter: Search (.* for a regular expression), Exclude (for example
/health), Lifecycle and events. Node, zone and architecture filters appear when your nodes differ. - Download saves the lines shown, with your filters.
- Jump shows five minutes before the crash to one minute after, pauses following and adds the crashed run's lines marked "(previous)".
- Time range: Last 5 min to Last 24 h, or custom. Scrolling up pauses following; scrolling to the bottom resumes it.
- New pods join without a reload; a deleted pod's lines stay. A pod picked by two sources is read once.
- Limits: 40 streams and the newest 10,000 lines. The status line says when sources were cut.
2.6 Terminal, shell and port forwarding
The terminal dock opens terminals that already point at the selected cluster; pod and node shells open from their pages.
- Cluster terminal: Ctrl + ` opens or hides the dock (1.4 shows one). Profiles: cmd, PowerShell and your WSL distributions (default in Preferences → Terminal).
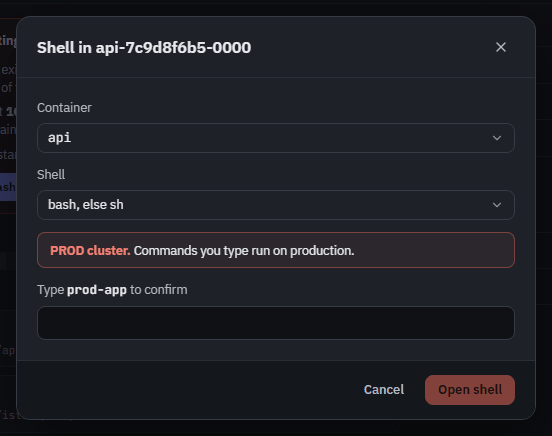
kubectlandhelmgo to the selected cluster; the bundled ones are on the PATH. - Pod shell: Shell on a pod page, or Ctrl + E in the palette.
- Node shell: from a node's page. Kubby runs a temporary privileged pod on the node and removes it when you close the shell.
- Port forward: Port forward on a pod page forwards a pod port to your computer while Kubby stays open.
2.7 Command palette and shortcuts
Ctrl + K opens the palette. Resources, pages and actions are searched together; recent pages stay on top, and the palette offers the other clusters when the open one has no match.
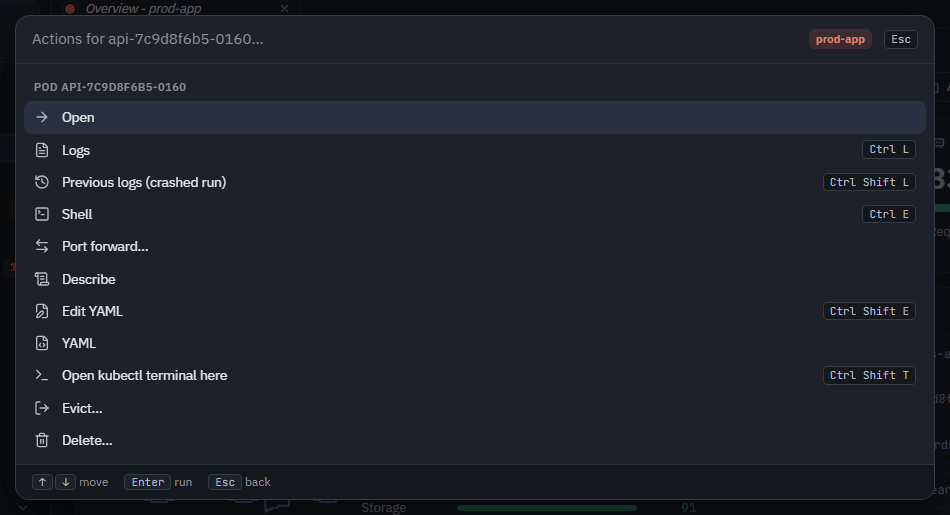
- Press Ctrl + K and type a name.
- Type
>first to list commands only. - Press Tab to see the actions of the highlighted row (logs, shell, describe…).
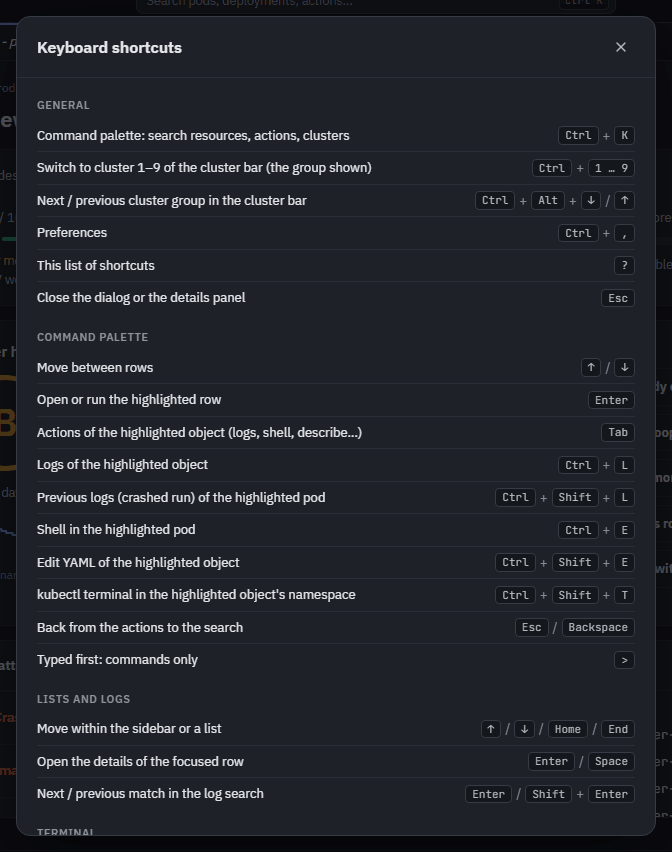
| Shortcut | What it does |
|---|---|
| Ctrl + K | Command palette |
| Ctrl + 1 … 9 | Cluster 1–9 of the cluster bar |
| Ctrl + Alt + ↓ / ↑ | Next / previous cluster group |
| Ctrl + , | Preferences |
| ? | List of shortcuts |
| Esc | Close the dialog or the details panel |
| Ctrl + ` | Open or hide the terminal dock |
| Ctrl + F | Find in a code view |
| Ctrl + L (palette) | Logs of the highlighted object |
| Ctrl + Shift + L (palette) | Previous logs (crashed run) of the highlighted pod |
| Ctrl + E (palette) | Shell in the highlighted pod |
| Ctrl + Shift + E (palette) | Edit YAML of the highlighted object |
| Ctrl + Shift + T (palette) | kubectl terminal in the highlighted object's namespace |
3. Making changes
3.1 Editing YAML and creating resources
Kubby validates YAML, shows the difference, and only then applies it.
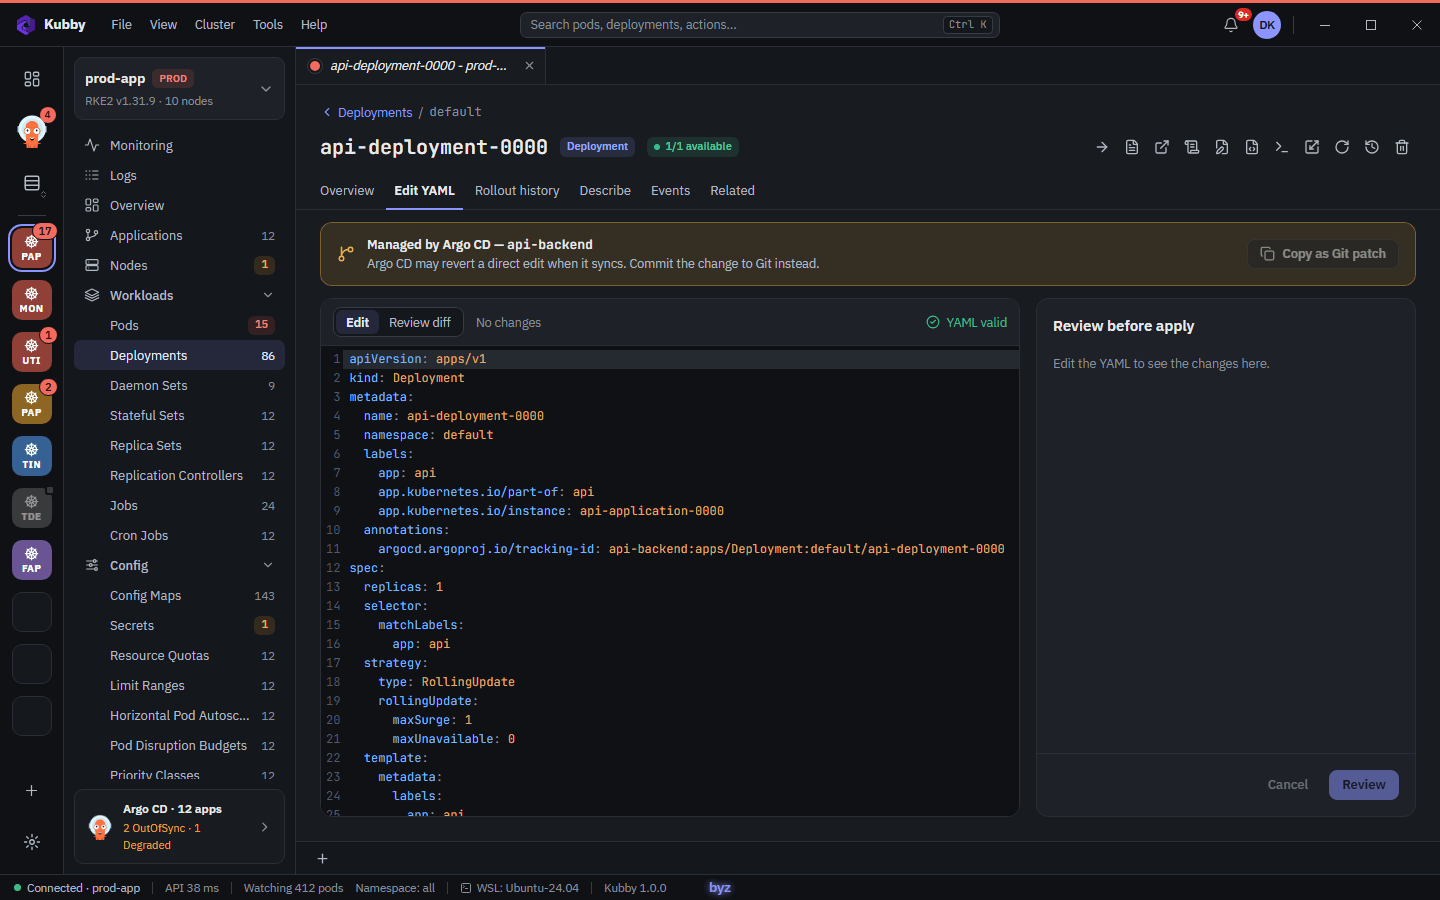
- Open the Edit YAML tab on the resource page. The editor highlights and validates as you type.
- Make your change. Review before apply shows what will change.
- Apply. Kubby validates on the server and reports conflicts.
- Argo CD resources: the next sync can revert a direct edit; Copy as Git patch takes the change to Git. Helm workloads: the change is offered through Helm.
- Ctrl + F finds in code views; in editors the replace row opens too.
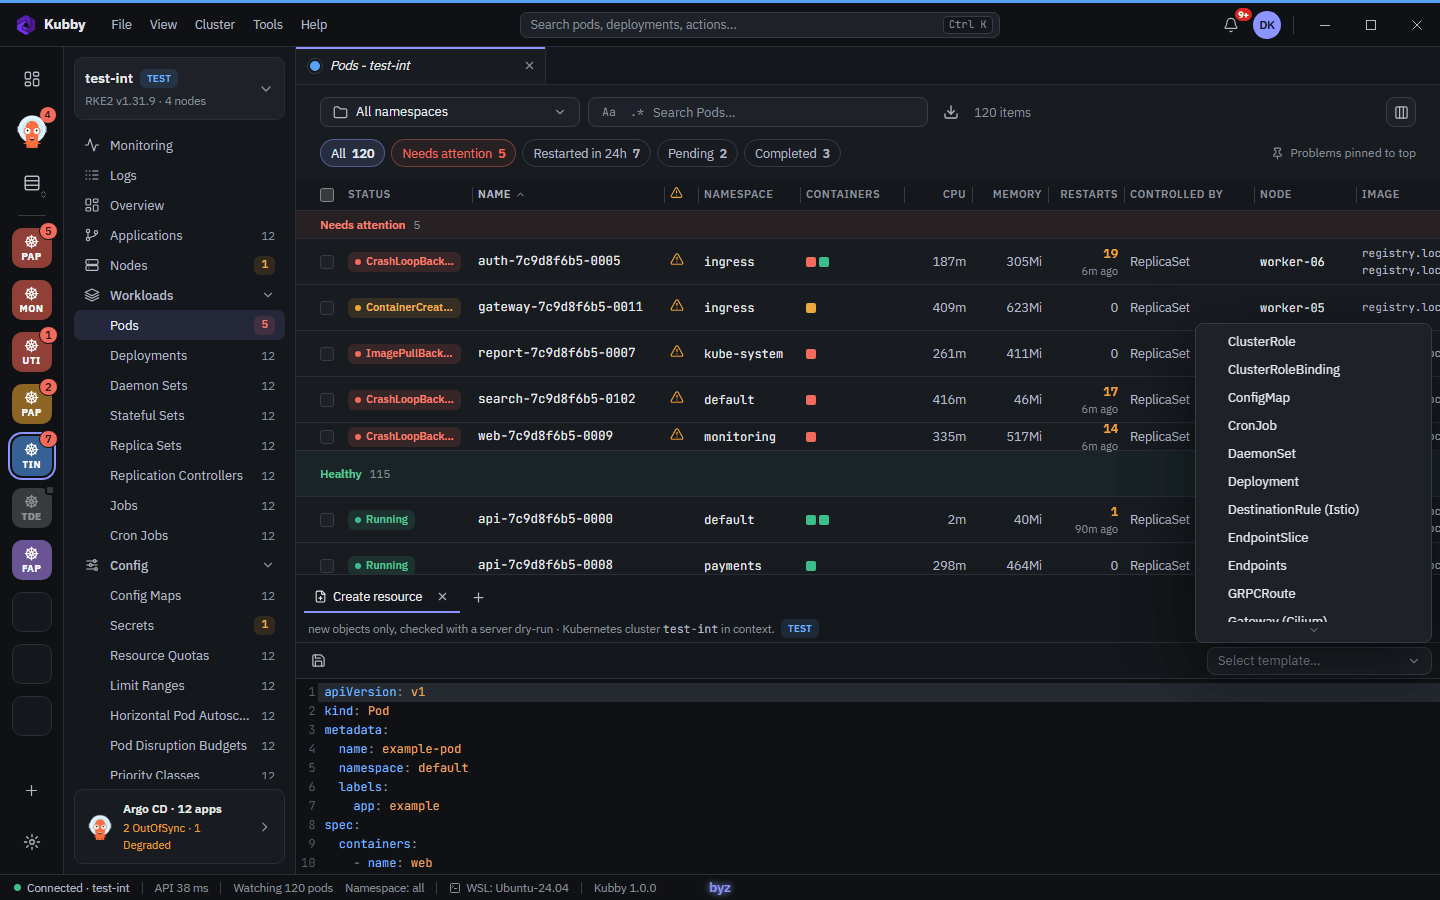
To create a resource:
- Click + on a list page. The create editor opens in the bottom dock.
- Select template: core kinds (Pod, Deployment, Service, Ingress, ConfigMap, Secret…), Gateway API, Traefik and Istio.
- Edit and create. Kubby runs a server-side dry-run first; errors show under the editor.
3.2 Actions and PROD protection
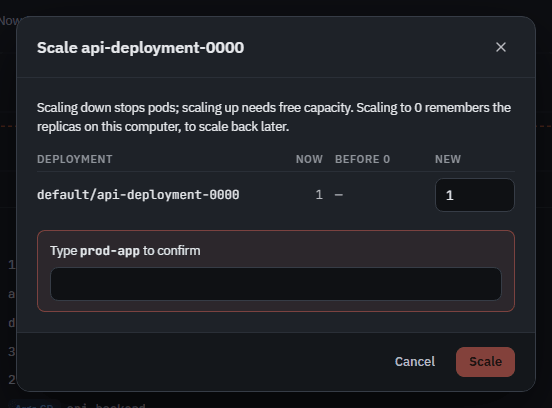
Actions are in the toolbar of a resource page and in the right-click menu of lists. On a protected cluster every change waits for the cluster name.
| Action | Kinds |
|---|---|
| Scale | Deployment, StatefulSet, ReplicaSet |
| Restart | Deployment, StatefulSet, DaemonSet |
| Rollout history and rollback | Deployment |
| Cordon, uncordon, drain | Node |
| Run now (Trigger) | CronJob |
| Delete | All resources |
| Reveal a Secret value | Secret |
- PROD protection: in a protected environment, or with Confirm every change, type the cluster name to confirm.
- Read-only: with Open read-only, every changing action is off and Secret values cannot be edited.
- Scaling to zero: Kubby remembers the previous replica count and offers it when you scale back up.
- Every change (applied, refused or conflicting) goes to the audit log (3.4).
3.3 Helm
Helm → Releases lists the releases with namespace, chart, version, status and last update; a badge shows when a newer chart exists.
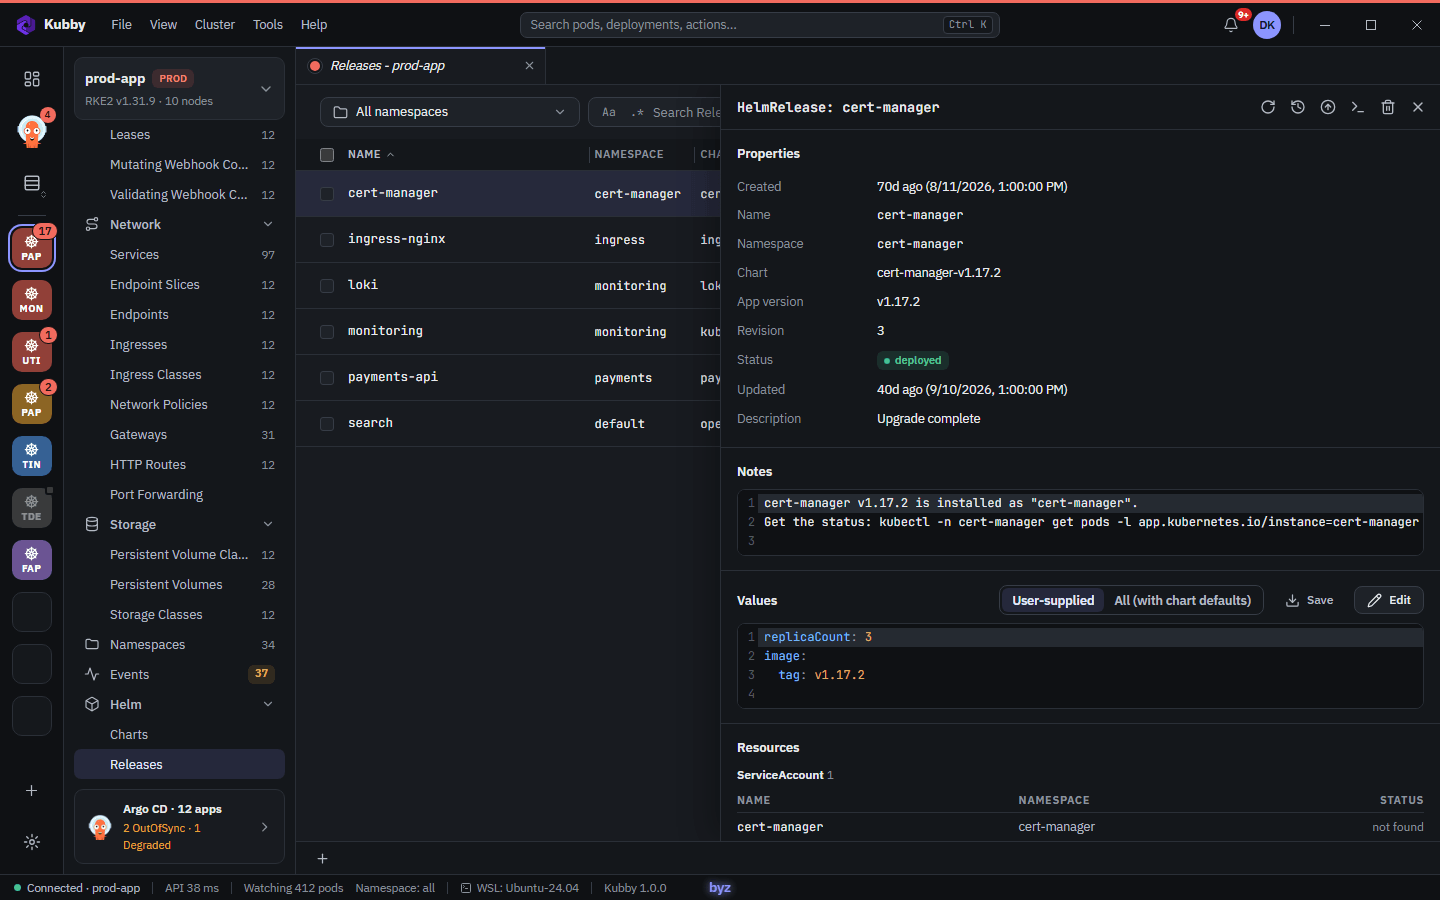
- Details: user-supplied and computed values, revision history, the release's resources and their health, the README.
- Compare two revisions; save the values (secrets masked).
To upgrade or roll back:
- Choose Upgrade in the release menu. Edit the values or pick another chart version.
- Check the dry-run result.
- Confirm. To go back, use Roll back and pick a revision from the history.
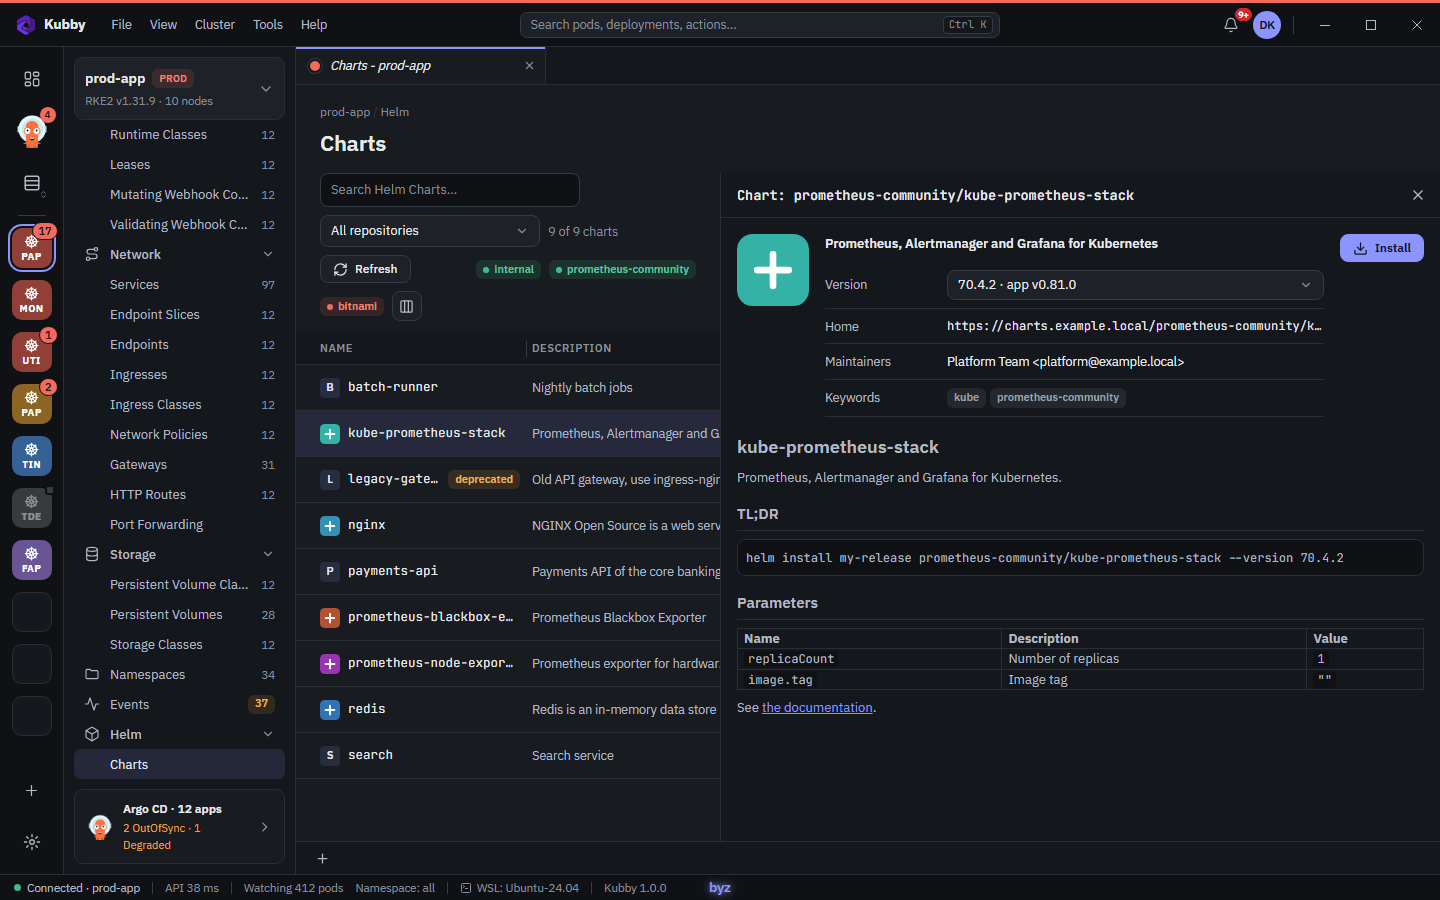
Pick a chart in Helm → Charts and install it with your values. Add repositories in Preferences → Kubernetes → Helm repositories. Helm actions are covered by PROD protection and the audit log.
3.4 Audit log
Every change made from Kubby is recorded with user, cluster, action, resource and result. Open it with Tools → Audit log.
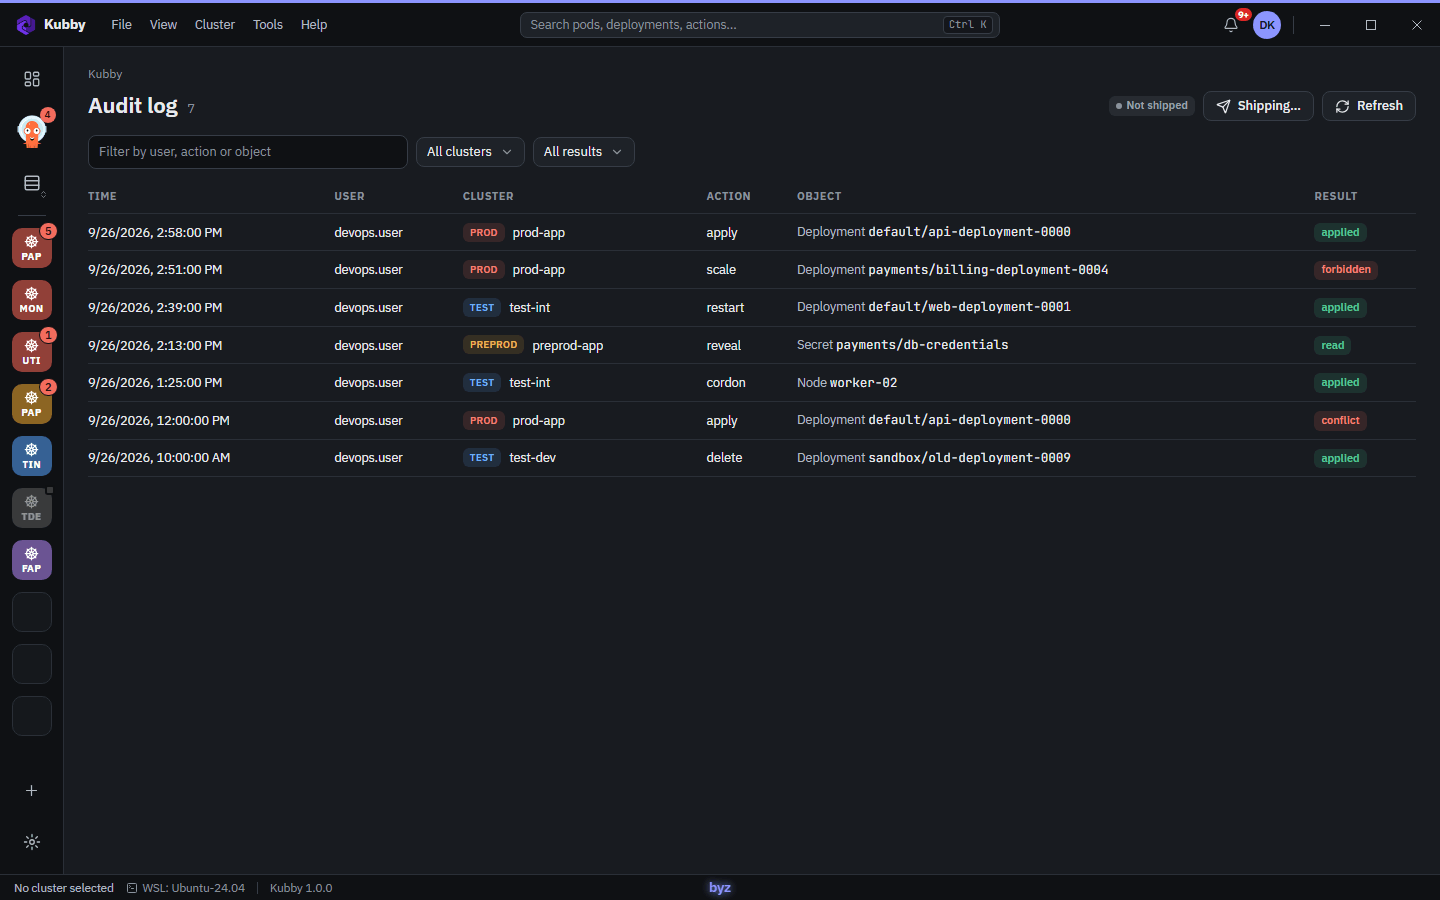
- Recorded: YAML applies, scaling, restarts, deletes, cordon and drain; Helm upgrades, rollbacks and uninstalls; Argo CD operations; revealing Secret values; accepted health findings; installs by the setup assistant.
- Result of each entry: applied, forbidden, conflict or read. Refused actions are recorded too.
- Search by user, action or resource; filter by cluster and result.
- The log stays on your computer and never holds Secret values or credentials. Shipping settings: Preferences → Audit log.
4. Integrations
4.1 Monitoring
Monitoring shows ready-made dashboards from the cluster's own Prometheus (Rancher Monitoring, kube-prometheus-stack or the prometheus chart). Kubby reaches it through the Kubernetes API, so no port forward, ingress or token is needed.
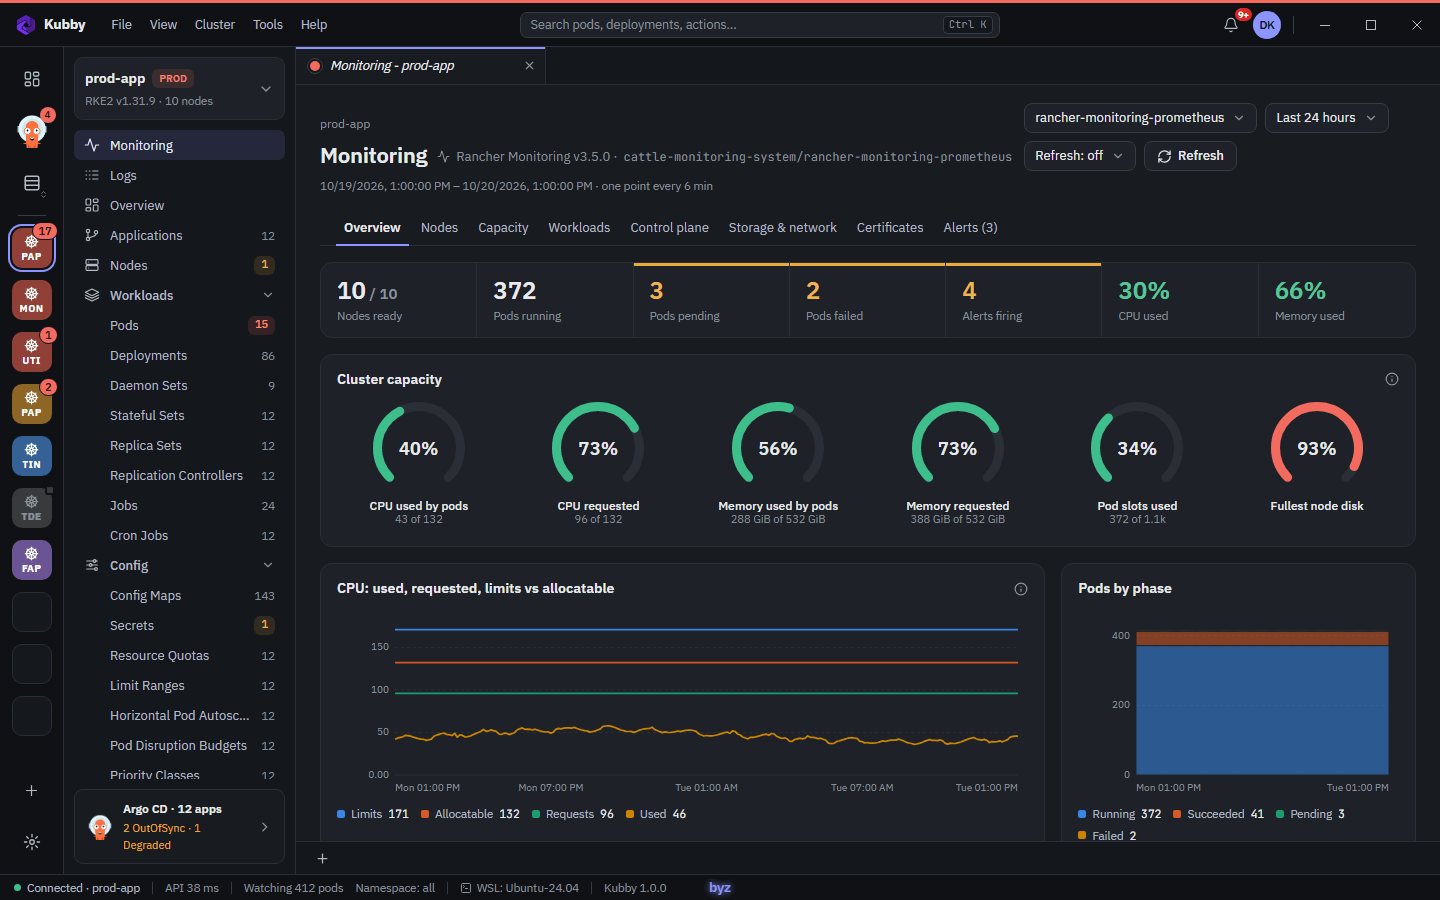
- Open Monitoring in the navigator. With several Prometheus services, pick one at the top right (remembered per cluster).
- Pick the time range (5 minutes to 24 hours) and auto-refresh (30 s, 1 or 5 min), or click Refresh.
- Click a namespace or pod in a bar list to open its charts.
| Tab | Content |
|---|---|
| Overview | Ready nodes, pod states, alerts; capacity; CPU and memory used, requested, limits. |
| Nodes | A card per node (IP, CPU, memory, disk, load, pods, OS); click for disks and heaviest pods. Table view too. |
| Capacity | Requests now and if the biggest node fails; overcommit per node; unused requests; containers without memory limits. |
| Workloads | Top CPU and memory pods, restarts, OOMKilled, throttling, HPAs at maximum, failed CronJobs. |
| Control plane | API server, etcd, scheduler, CoreDNS, admission webhooks. |
| Storage & network | PVC and disk fill forecast, network traffic and errors, ingress 5xx. |
| Certificates | Days left on kubelet and cert-manager certificates. |
| Alerts | Firing and pending alerts; firing ones also appear in the bell. |
You need get on services/proxy for the Prometheus service; Kubby says so if it is missing.
4.2 Log stores and history
History on the Logs page reads past logs from Loki, Elasticsearch or OpenSearch, including pods that are gone.
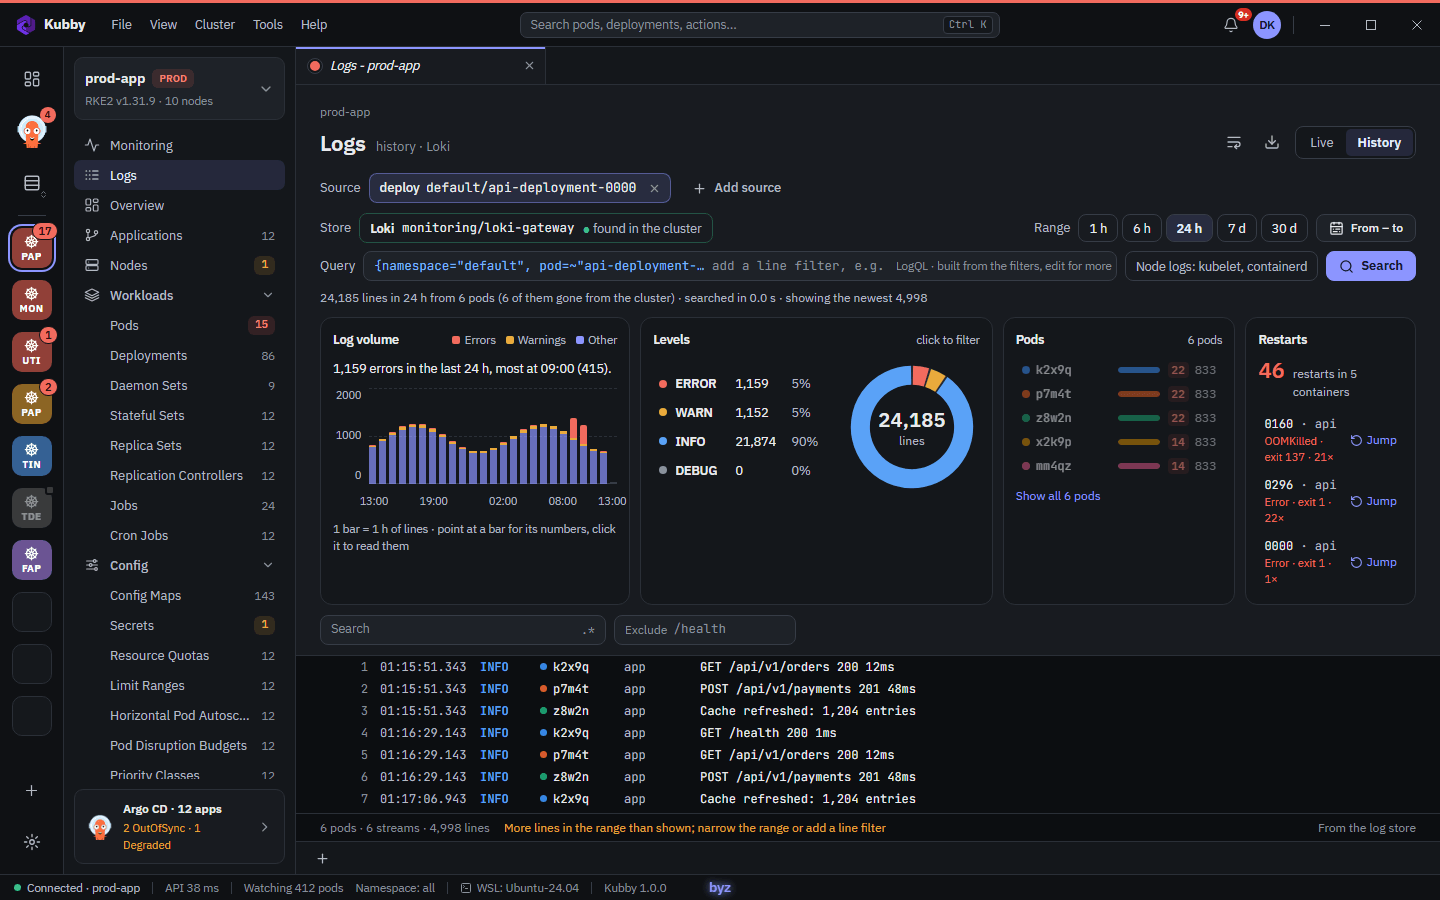
- On the Logs page, switch from Live to History. Your sources become a query (LogQL or Lucene) that you can edit.
- Pick the range (1 h to 30 d, or custom); click a volume bar to narrow it.
- Optional: Node logs: kubelet, containerd, when the store collects them.
- When Kubernetes no longer has a crashed run, Read it from the log store opens History around the crash.
- Stores in the cluster are found and read through the Kubernetes API with your rights. For Elasticsearch and OpenSearch, set index, TLS and credentials in Preferences → Monitoring and logs, then Test.
- Central stores: one store for all clusters, added per cluster with its https address, index and cluster label (for example
cluster=prod-app). Metrics can also come from a central Prometheus, Thanos, Mimir or VictoriaMetrics. - Credentials: Kubby never stores a password, key or token for a store. Put it in a Kubernetes Secret; Kubby keeps only its namespace, name and key.
WSL bash:
kubectl -n kubby-system create secret generic kubby-os-reader \
  --from-literal=username=kubby-reader --from-literal=password='<password>'
No store yet? History offers Set up logs and Use a central store (4.3).
4.3 Setting up logs and metrics
Kubby needs nothing in your clusters, but it can install a log store (Loki and Grafana Alloy, namespace kubby-loki) or a small Prometheus after showing what it costs. Nothing changes until you click Install.
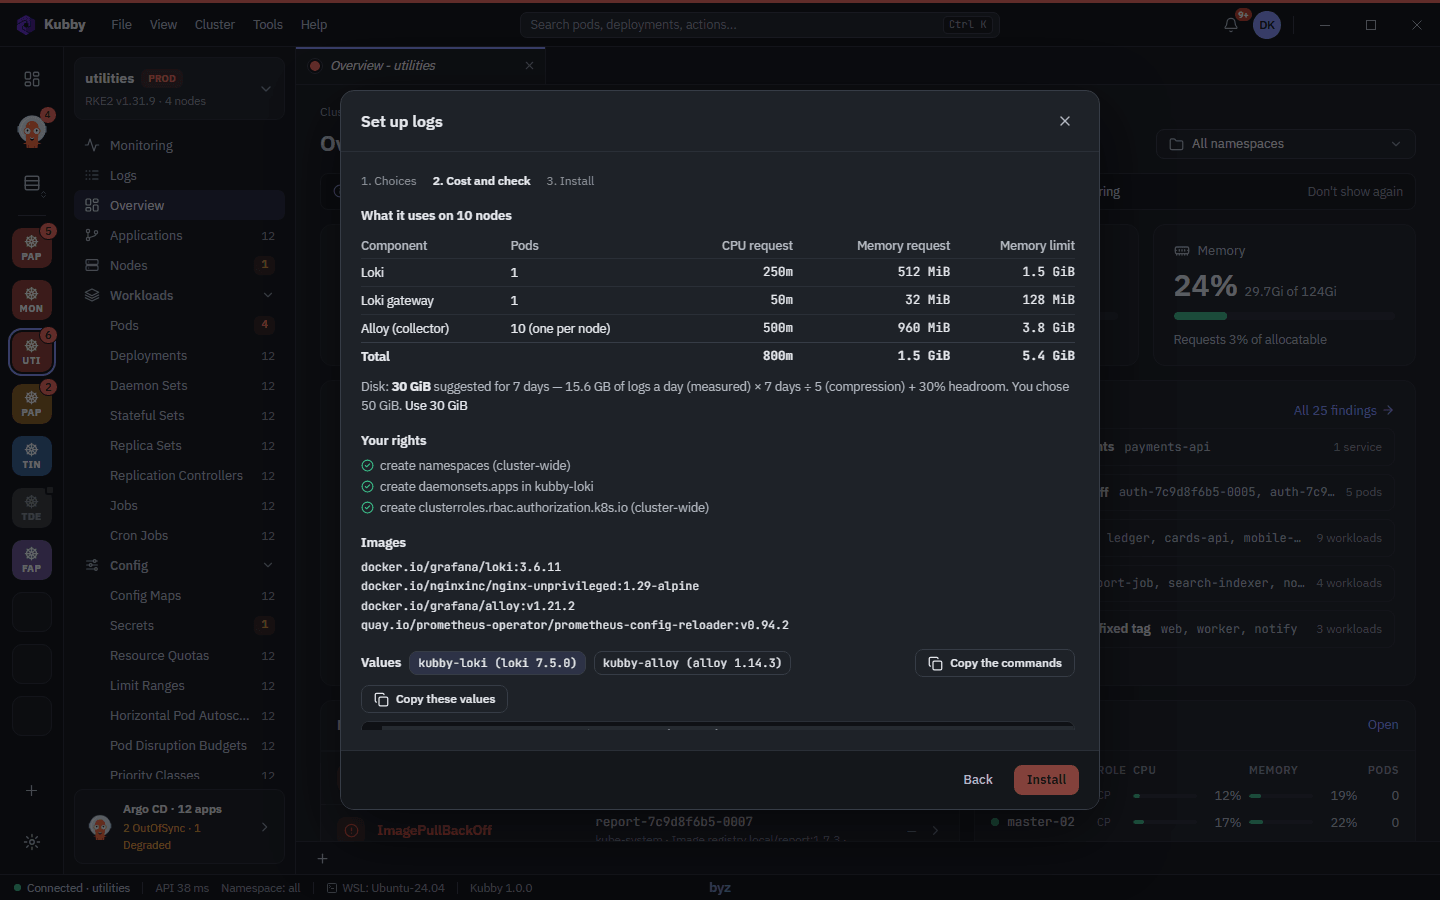
- Click Set up logs (on Overview or in Logs History) or Set up monitoring (in Monitoring).
- Choices: storage (PVC or S3), Keep for 1, 3, 7 or 14 days, images from the internet or your registry (for example
harbor.bank.local/mirror), charts from public repositories or your mirror. - Cost and check: Kubby measures the log rate for about a minute, then shows requests, a suggested disk size, your rights, images and values. Copy the commands gives your platform team the same install.
- Install: Helm installs and Kubby waits for the pods. On PROD you type the cluster name first; the install goes to the audit log.
Preferences → Monitoring and logs → Installed by Kubby lists these installs. Change upgrades; Remove uninstalls (disks stay unless you also delete the namespace and its disks).
4.4 Argo CD
The Argo CD centre (Argo CD icon in the cluster bar) connects one or more Argo CD instances.
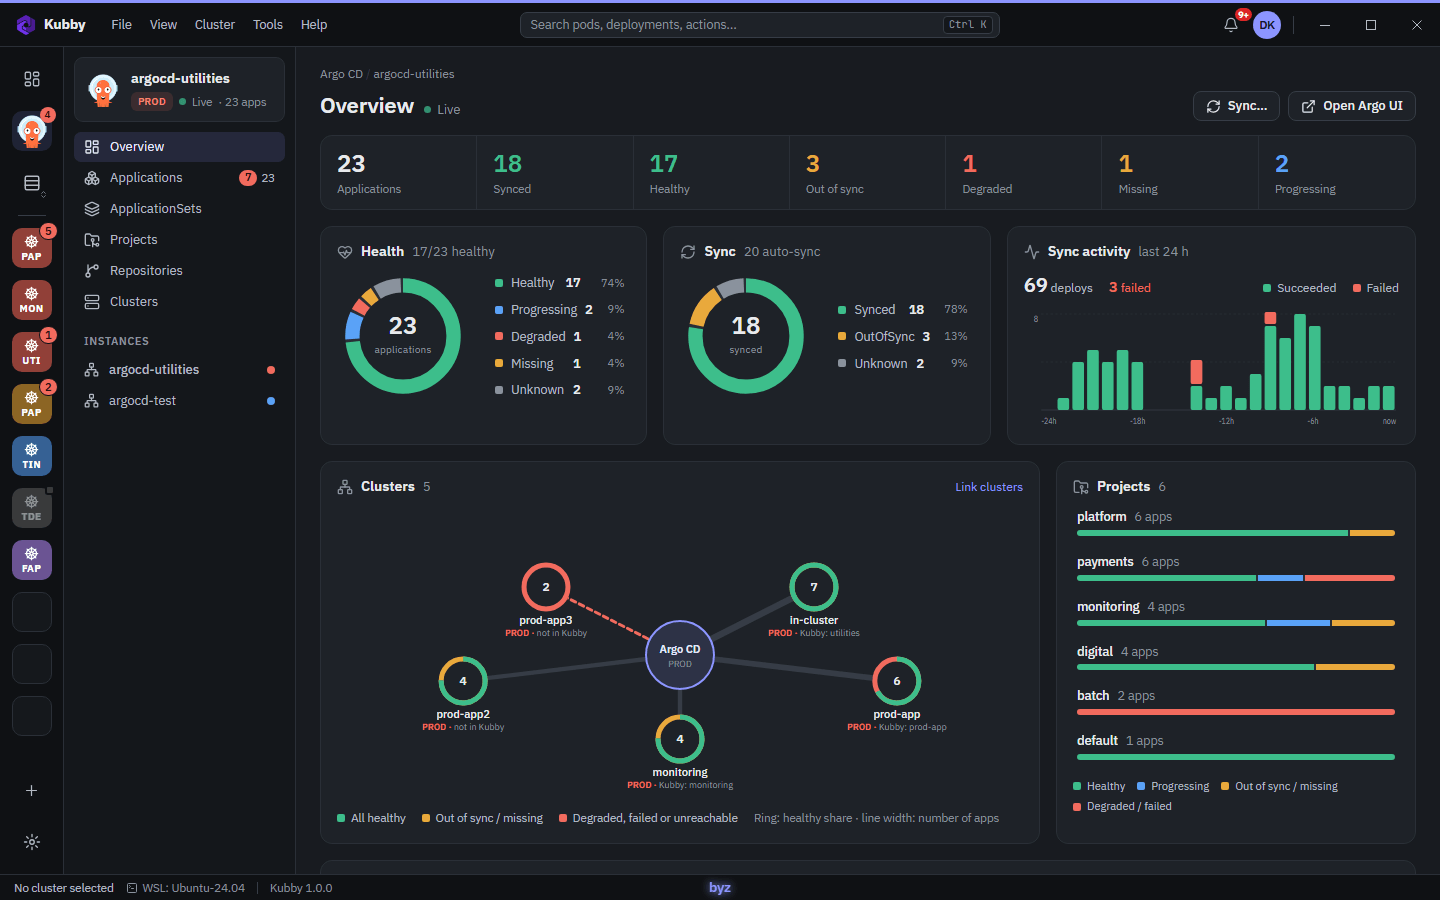
- Click the Argo CD icon in the cluster bar, then Add instance.
- Enter a name, the address and an environment, and paste an API token. Add the CA certificate if Argo CD uses a private one.
- Test connection shows the version, the user and your rights. Add the instance.
The token is kept in Windows Credential Manager, never in settings files or logs.
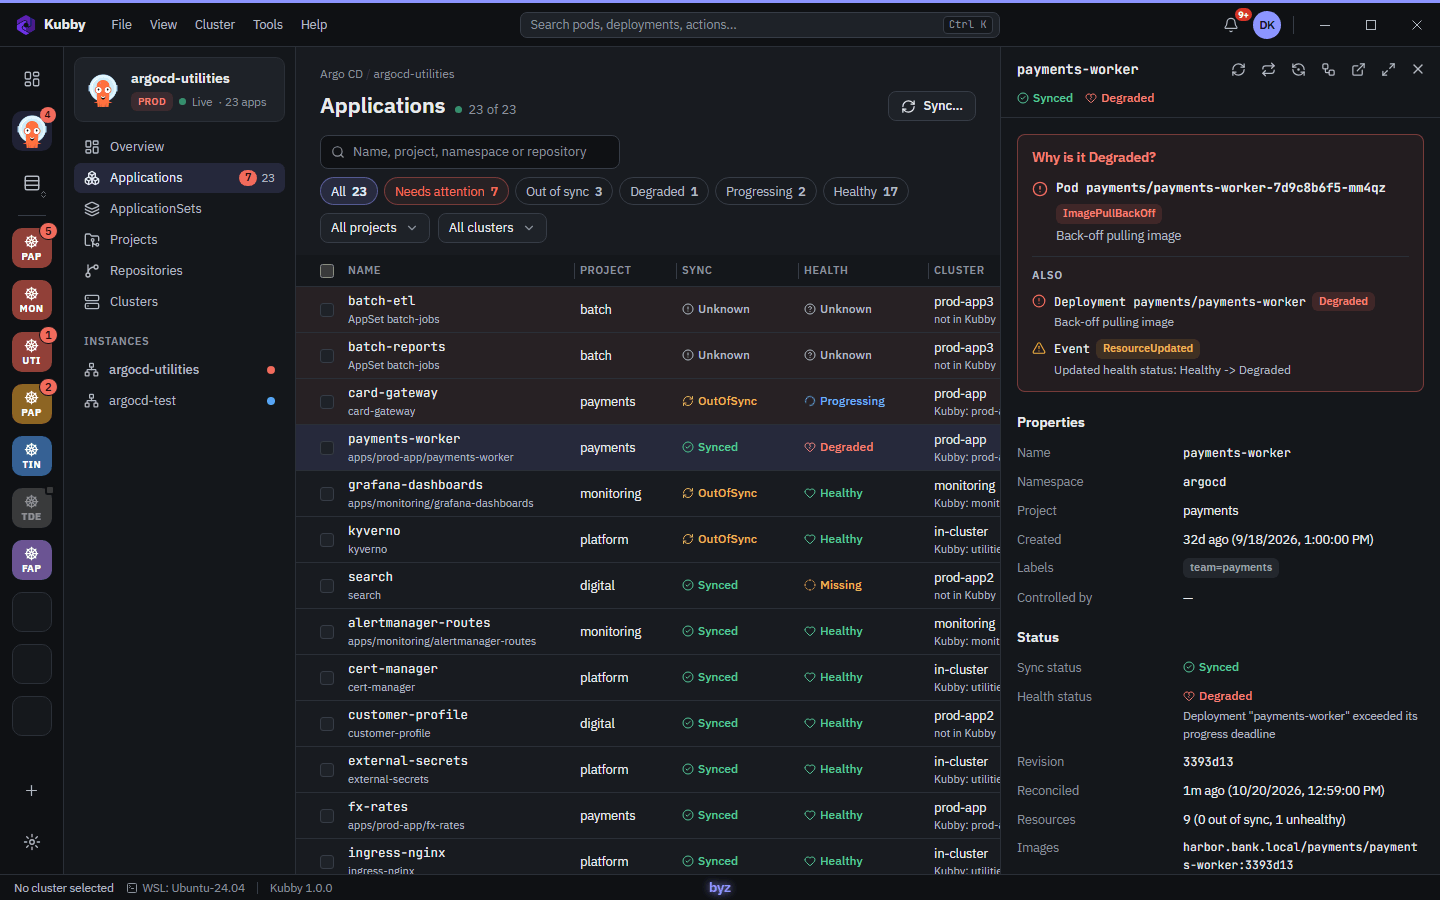
- Application page: summary, resource tree (graph or list), diff between Git and the cluster, history and rollback, events and logs.
- Diagnosis: for a Degraded application or a failed sync, Kubby names the cause. Click the resource to open it.
- Operations: sync, refresh, Hard refresh, rollback, terminate, auto-sync on or off. Kubby shows sync windows that block an operation. On PROD instances you type the instance name.
4.5 Ask Kubby
Ask Kubby is an AI troubleshooting assistant. It reads the live cluster through Kubby's read-only tools, with the AI model you choose. It is off until you turn it on.
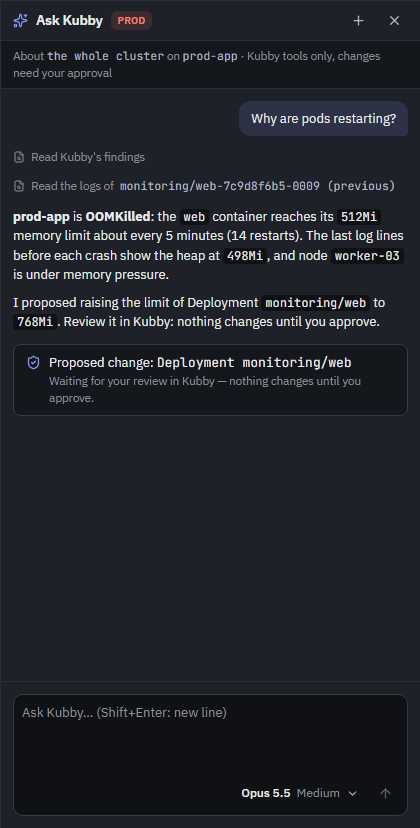
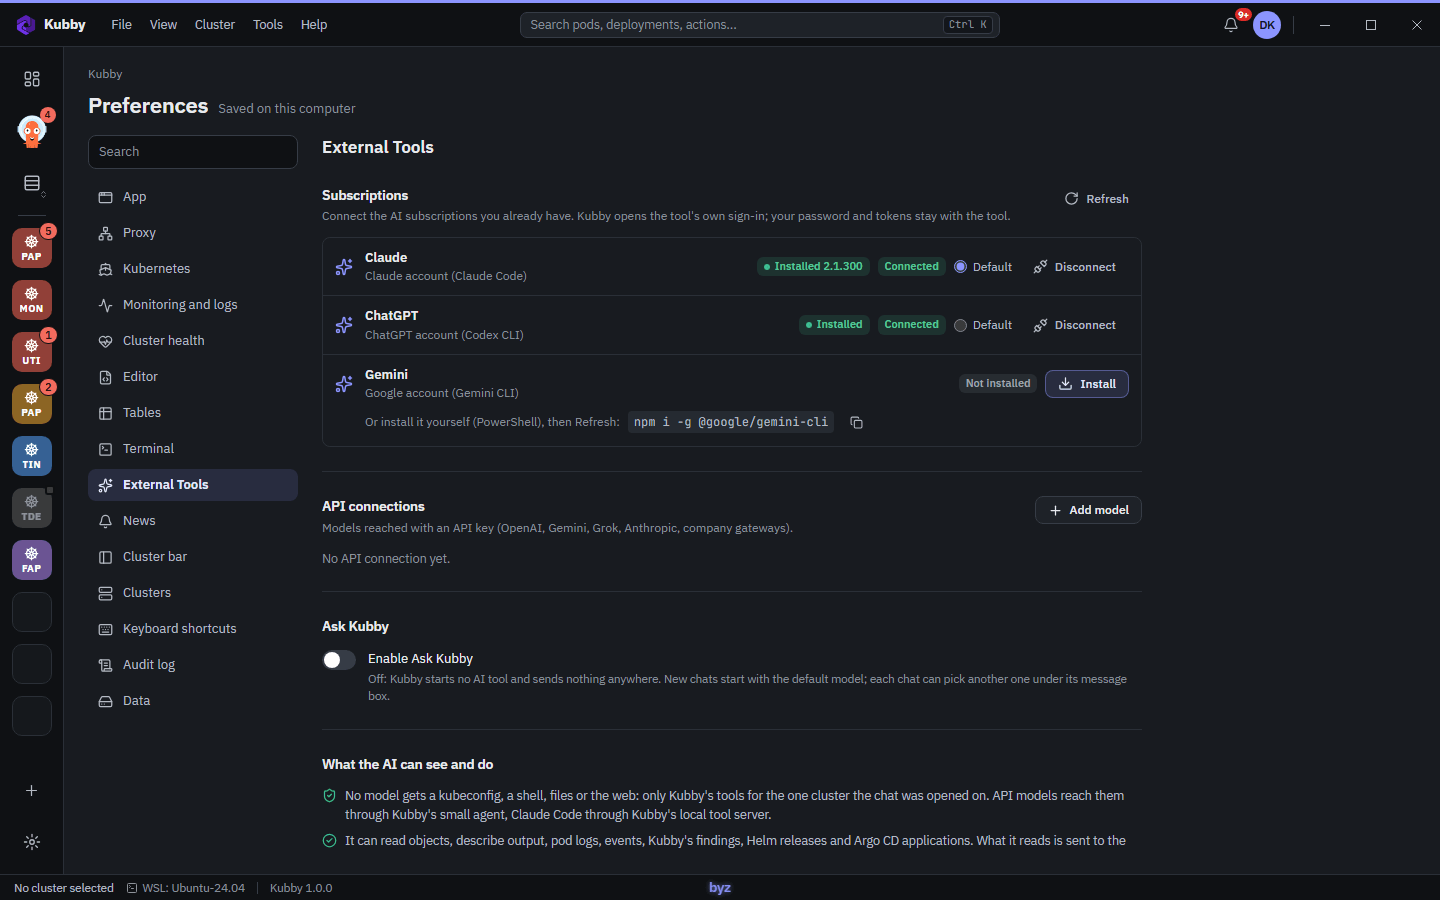
To turn it on:
- Open Preferences → External Tools.
- Add a connection: a Subscription (Claude Code, Codex CLI or Gemini CLI installed with your own subscription) or an API connection (Add model: OpenAI, Anthropic, Google Gemini, xAI or your company's OpenAI-compatible gateway; keys go to Windows Credential Manager).
- Choose the default connection and turn on Enable Ask Kubby. While it is off, Kubby starts no AI tool and sends nothing.
To ask:
- Click Ask Kubby on a page or in the details panel. The chat starts with your context (cluster, namespace, resource).
- Type a question, for example "Why does the pod web-7c9d8f6b5-0009 keep restarting?" or "If the biggest node fails, do the workloads fit on the rest?".
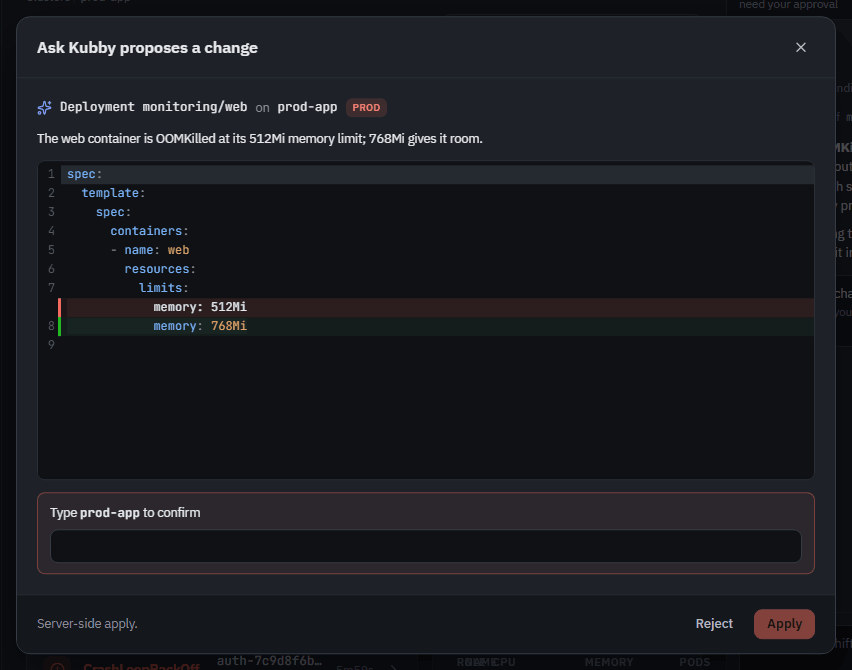
- Changes are never applied directly: Kubby previews them and waits for your approval, and they go to the audit log. For Argo CD resources Kubby reminds you to change Git; Helm workloads change through a Helm upgrade.
- Only Kubernetes, container, Helm and DevOps questions are answered. Off-topic questions never reach the model.
| Data | Where it goes |
|---|---|
| Your question and chat history | The AI provider you chose, with your own account or key. |
| Cluster data the model asks for | Only that, to the same provider. |
| Secret values, kubeconfig, tokens, passwords | Nowhere. Passwords and tokens in YAML, logs and Helm values are masked first. |
| Off-topic questions | Nowhere. Kubby declines them itself. |
| Kubby's servers | Nothing. Chats are not sent there. |
If your company policy requires it, use the AI gateway your company approved.
5. Troubleshooting guides
5.1 CrashLoopBackOff
A container starts, exits, and Kubernetes waits longer each time before restarting it (10 s, 20 s, 40 s … up to 5 minutes). The cause is in the exit code, the previous run's logs and the events.
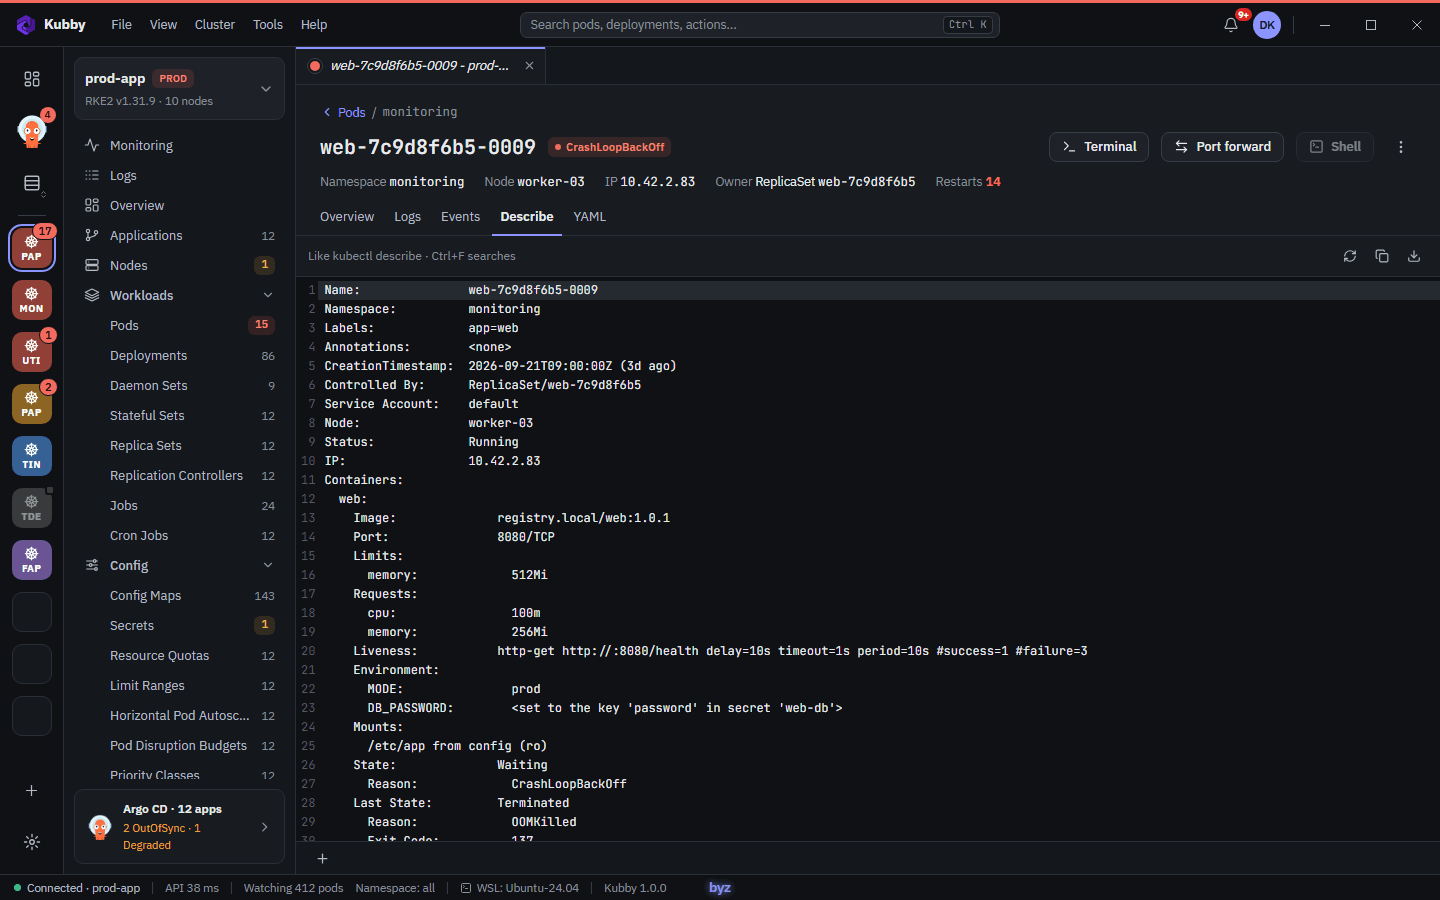
In Kubby: crash-looping pods are on top of Overview and Pods; Why is it restarting? shows the exit code, reason and pattern; Logs before crash opens the previous run.
From the command line (PowerShell or WSL bash):
kubectl describe pod <pod> -n <ns>
kubectl logs <pod> -n <ns> -c <container> --previous
kubectl get events -n <ns> --field-selector involvedObject.name=<pod>| Exit code | Usually means | Check |
|---|---|---|
| 1 | Application error | Previous logs: configuration, missing variable or Secret, unreachable database. |
| 137 | SIGKILL, often OOMKilled | Memory limit vs usage (5.2). |
| 139 | Segmentation fault | Native library or wrong-architecture binary. |
| 143 | SIGTERM | Failing liveness probe or slow shutdown. |
| 0 | Process ended normally | Not a long-running command; use a Job. |
Frequent causes: missing configuration; a liveness probe that is too strict (add a startupProbe or raise initialDelaySeconds / failureThreshold); a dependency not ready; too little memory; wrong command or image.
5.2 OOMKilled
The kernel stopped a container because it went over its memory limit (exit code 137), or the node ran out of memory (MemoryPressure; pods above their requests are killed first).
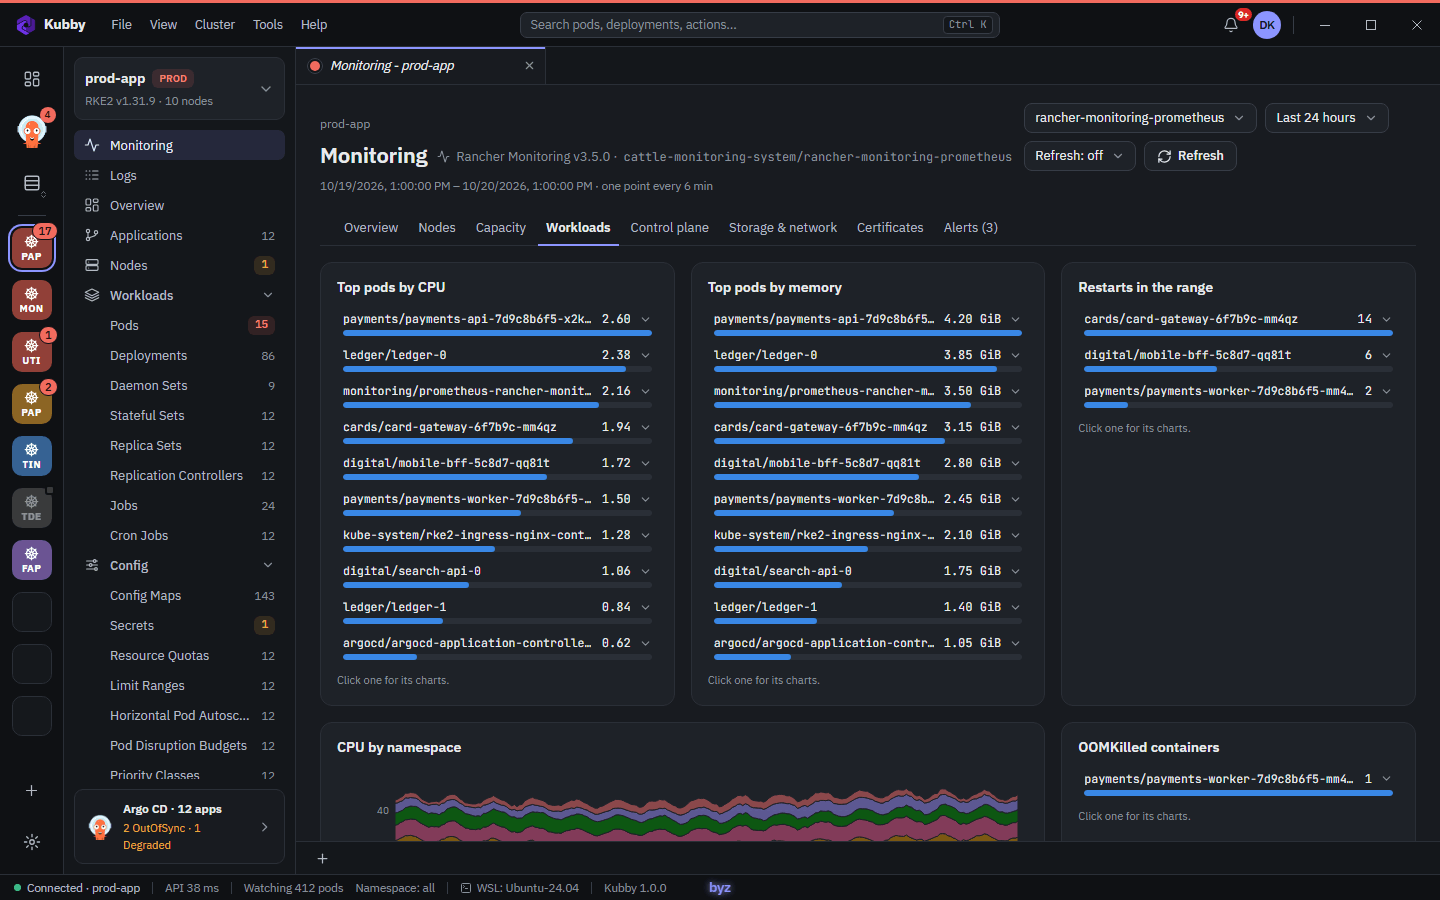
In Kubby: Overview lists OOMKilled pods with the limit; Why is it restarting? shows the limit and the highest usage; the memory chart draws the limit line. Monitoring → Capacity lists containers without memory limits.
Confirm (PowerShell or WSL bash; kubectl top needs metrics-server):
kubectl describe pod <pod> -n <ns>
kubectl top pod <pod> -n <ns> --containers
kubectl describe node <node>
Fix:
- Set the limit from the peak usage over a day or a week, plus 20–30 %; set requests close to real usage.
- Size runtimes to the container: JVM
-XX:MaxRAMPercentage, Node.js--max-old-space-size, worker counts. - If usage grows until the kill, look for a leak. If the node runs out, add capacity.
- With Argo CD or Helm, change the limit in Git or the Helm values.
5.3 ImagePullBackOff
The kubelet cannot pull the image, so the pod never starts. The reason is in the events.
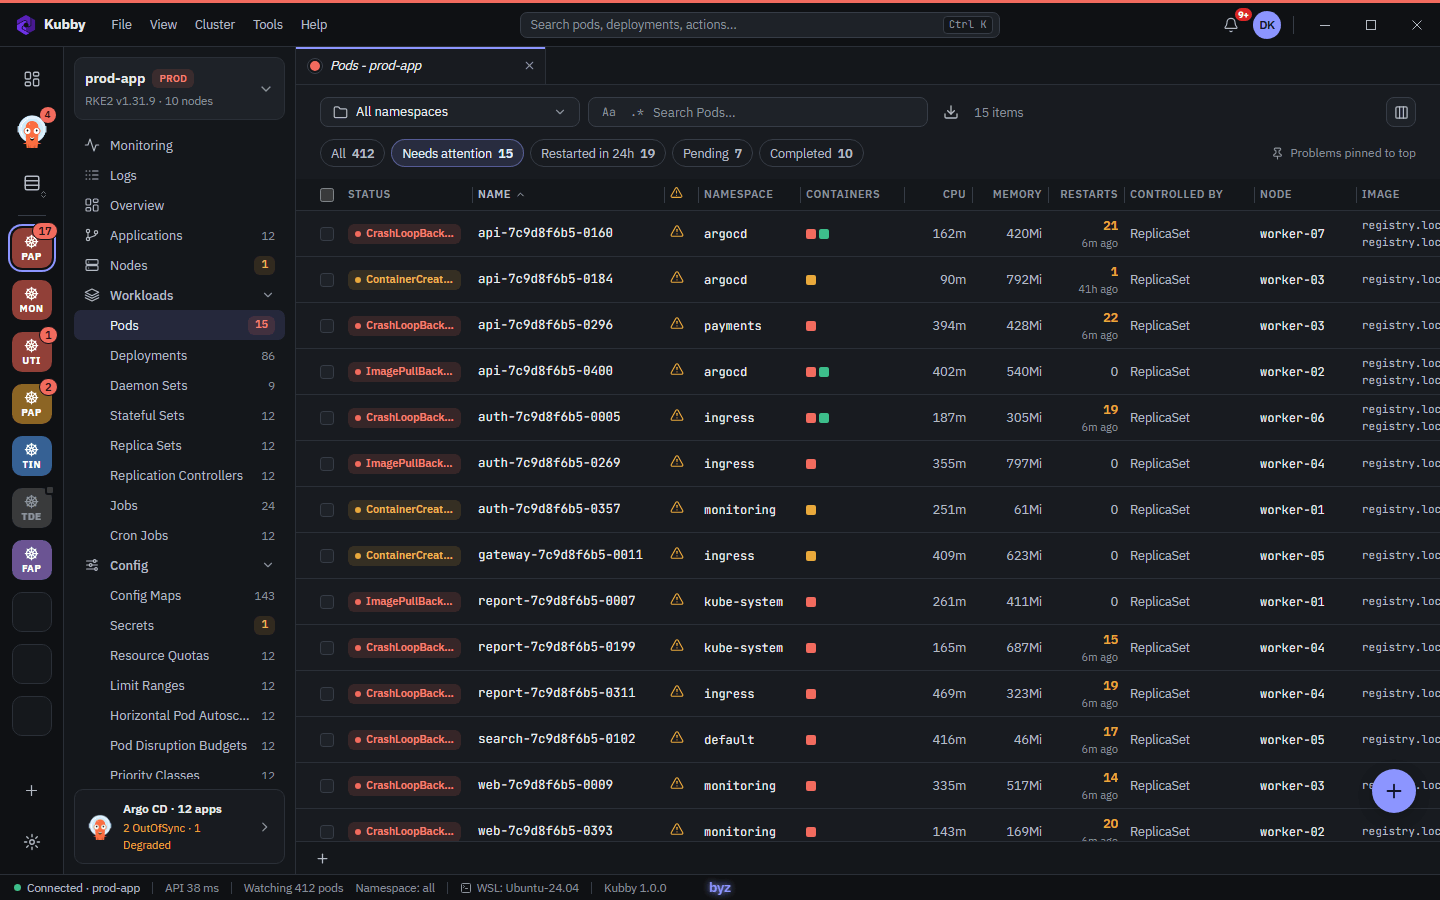
In Kubby: ImagePullBackOff pods are on top with the image and the registry's message. In the Argo CD centre, the diagnosis of a Degraded application points at the pod that cannot pull.
Find the message (PowerShell or WSL bash):
kubectl describe pod <pod> -n <ns>
kubectl get pod <pod> -n <ns> -o jsonpath="{.spec.containers[*].image}"
On the node (WSL bash or SSH session): crictl pull <image>.
| Message contains | Cause | Fix |
|---|---|---|
manifest unknown, not found | Tag or digest does not exist | Fix the tag or push the image. |
unauthorized, authentication required, 403 | Registry needs credentials | A docker-registry Secret in imagePullSecrets or on the ServiceAccount. |
i/o timeout, no such host, connection refused | Node cannot reach the registry | DNS, firewall, runtime proxy or a mirror. |
x509: certificate signed by unknown authority | Private CA | Add the CA to the container runtime on every node. |
toomanyrequests | Rate limit | Authenticate, use a pull-through cache or mirror. |
no matching manifest for | Wrong architecture | Multi-arch image or matching nodes. |
Prevent it: pin images by digest or immutable tags, keep pull secrets on the ServiceAccount, fix bad tags in Git.
5.4 Pending pods
The scheduler finds no node that fits, or something the pod needs is not ready. It places pods by requests, not by real usage: a cluster at 40 % CPU usage can still refuse pods if requests add up to 100 %.
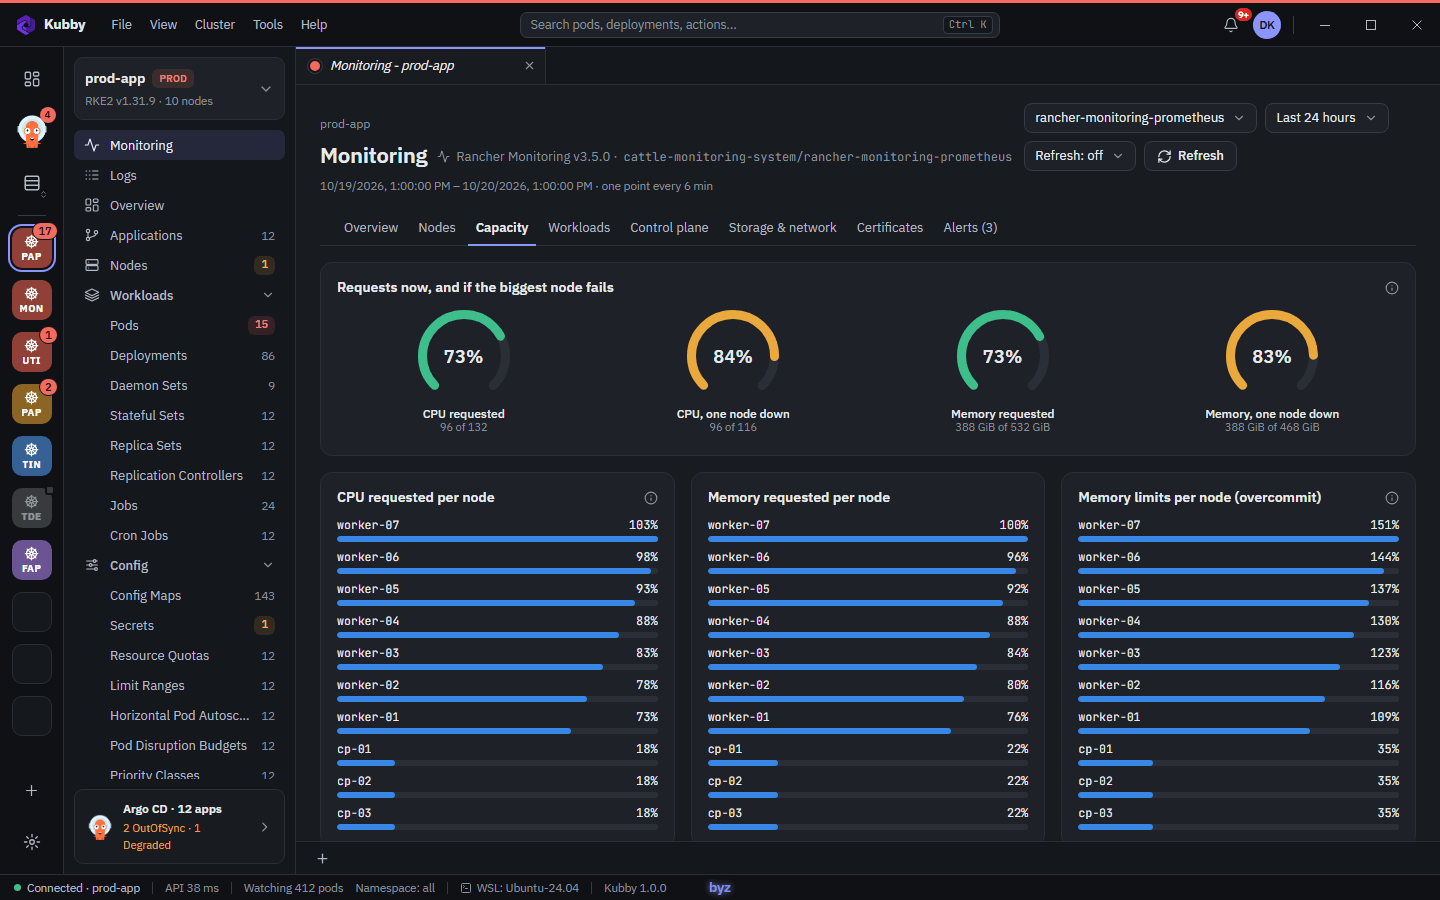
In Kubby: unschedulable pods appear in Needs attention as Unschedulable with the scheduler's message; the Pods list has a Pending filter.
Read the scheduler's message (PowerShell or WSL bash) with kubectl describe pod <pod> -n <ns> and look for a FailedScheduling event.
| Event says | Meaning | Fix |
|---|---|---|
Insufficient cpu / Insufficient memory | No node has enough unrequested capacity | Lower requests, free capacity or add nodes. |
untolerated taint | Nodes are tainted | Add a toleration or run the pod elsewhere. |
didn't match Pod's node affinity/selector | Selector matches no node | Fix labels or selector. |
pod has unbound immediate PersistentVolumeClaims | PVC not bound | Check StorageClass and provisioner; kubectl describe pvc. |
volume node affinity conflict | No free node in the volume's zone | Add capacity there, or WaitForFirstConsumer. |
Too many pods | Pod limit per node reached | Add nodes or raise maxPods. |
exceeded quota (on the ReplicaSet) | ResourceQuota blocks the pod | kubectl describe quota -n <ns>; raise quota or lower requests. |
5.5 Certificate expiry
Three groups matter: control plane and kubelet certificates, application TLS certificates, webhook CAs.
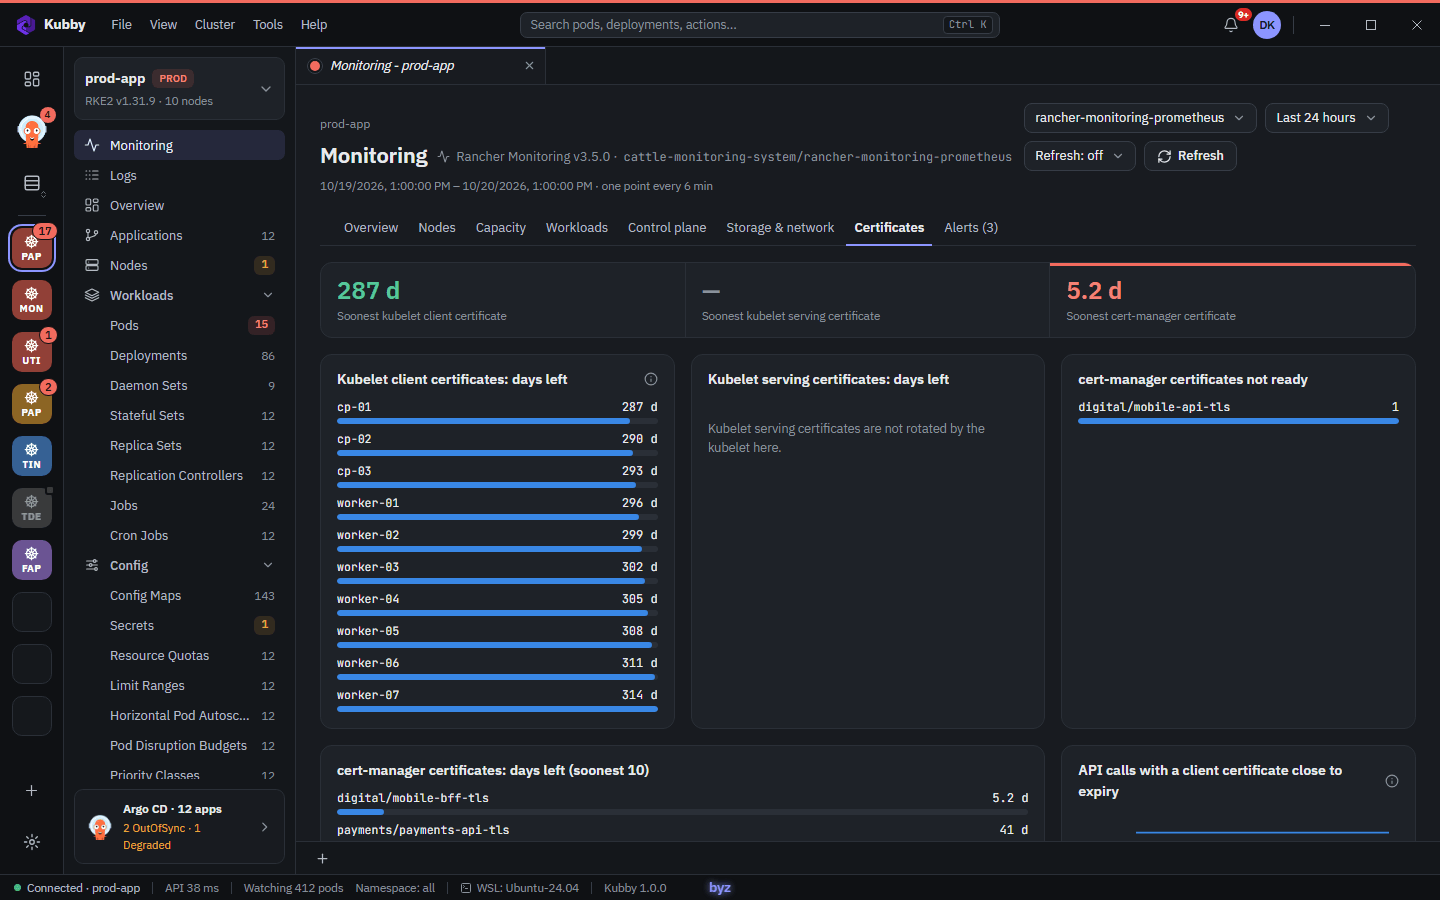
In Kubby: TLS Secrets that expire within 30 days or have expired appear in Needs attention.
- RKE2 / k3s: certificates last 12 months and renew when the service restarts within 90 days of expiry;
rke2 certificate rotate(on the server node) forces it. - kubeadm:
kubeadm certs check-expirationandkubeadm certs renew allon a control plane node. - cert-manager (PowerShell or WSL bash):
kubectl get certificates -AshowsREADY;kubectl describe certificate <name> -n <ns>shows the renewal time and the last error;cmctl renew <certificate> -n <ns>renews after you fix the cause. - A TLS Secret (WSL bash):
``bash kubectl get secret <name> -n <ns> -o jsonpath="{.data.tls\.crt}" | base64 -d | openssl x509 -noout -enddate ``
Kubelet client certificates rotate by themselves; serving certificates need serverTLSBootstrap and approved CSRs. Prometheus alerts: certmanager_certificate_expiration_timestamp_seconds - time() < 14 * 24 * 3600 and kubelet_certificate_manager_client_ttl_seconds.
6. Account and settings
6.1 Notifications
The bell in the top bar shows unread news and alerts ("9+" above nine). Click it to open the panel.
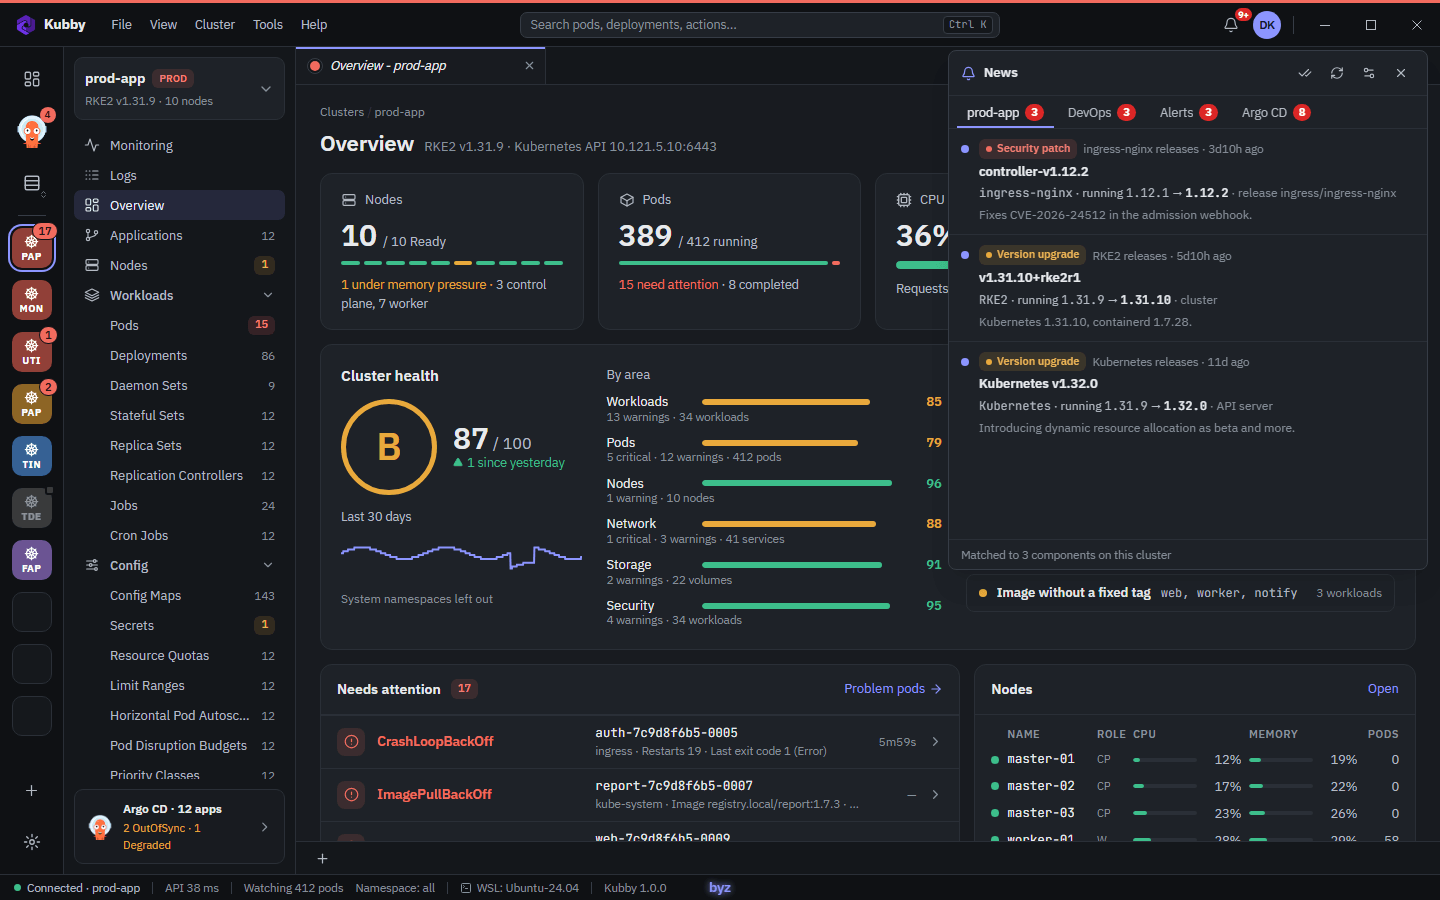
| Tab | Shows |
|---|---|
| Cluster (its name) | News only for components running in the open cluster: Kubernetes and RKE2, kubelet, node OS and runtime, Helm releases, images. |
| DevOps | General news from CNCF, Kubernetes and the blogs you choose. |
| Alerts | Firing alerts from the cluster's Prometheus. |
| Argo CD | Applications that need attention. |
- Categories: Security patch, Version upgrade ("running 1.12.1 → 1.12.2"), New feature. Versions you already run are not shown.
- An item counts as read after 2 seconds on screen or when you open it; Mark all as read marks all. Clicking an item opens the article in your browser.
- Sources: Preferences → News (turn sources off, add your own https RSS or Atom feeds, refresh every 1, 6 or 24 hours).
6.2 Notes
A small notebook inside Kubby, saved only on your computer.
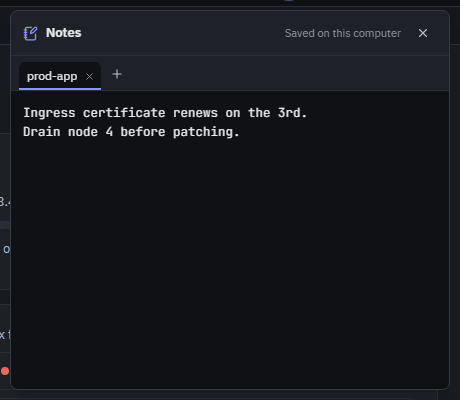
- Open the profile menu (your initials, top right) → Notes.
- + opens a new note tab; double-click a tab to rename it.
- Close the panel with Esc. Closing a tab removes it and its text for good (Kubby asks first).
Notes are never sent anywhere and never written to logs.
6.3 Account and security
Kubby has a local account for each Windows user: you sign in with your password and the 6-digit code from your authenticator app.
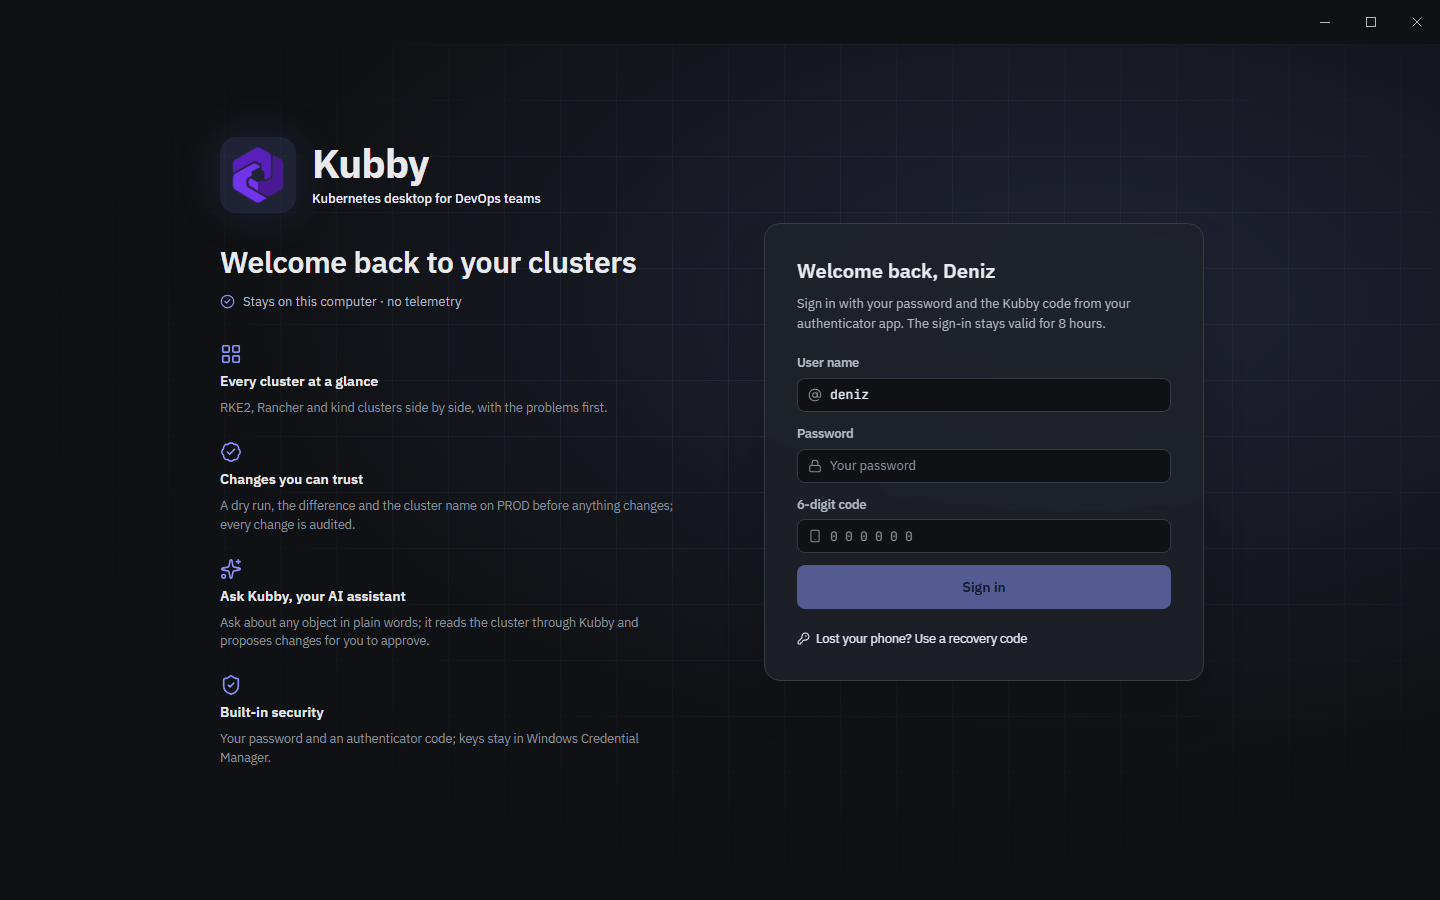
- A sign-in lasts 8 hours. After 5 wrong attempts in a row Kubby makes you wait, longer each time.
- Lost phone: choose Use a recovery code, enter your password and one of your 10 recovery codes (each works once), then set up the authenticator again.
- The password and recovery codes are stored only as an Argon2id hash; the authenticator key and the session are in Windows Credential Manager.
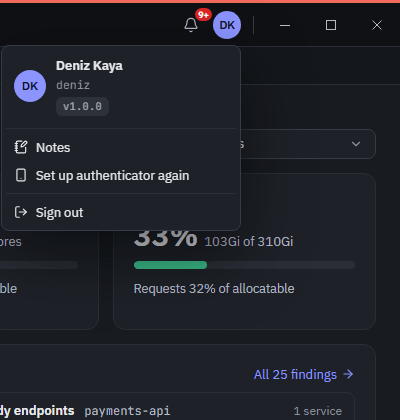
What leaves your computer:
- Cluster data never does. Kubby only asks kubby.tech for a newer version and sends nothing but its version number. No telemetry.
- Kubeconfigs are plain files in
%APPDATA%\Kubby\kubeconfigs; Argo CD tokens and AI keys are in Windows Credential Manager. None of them go to logs. - Application logs are daily files; only the last 5 days are kept.
6.4 Preferences
Open with Ctrl + , or File → Preferences…. Settings are saved on your computer; the search box finds a setting by name.
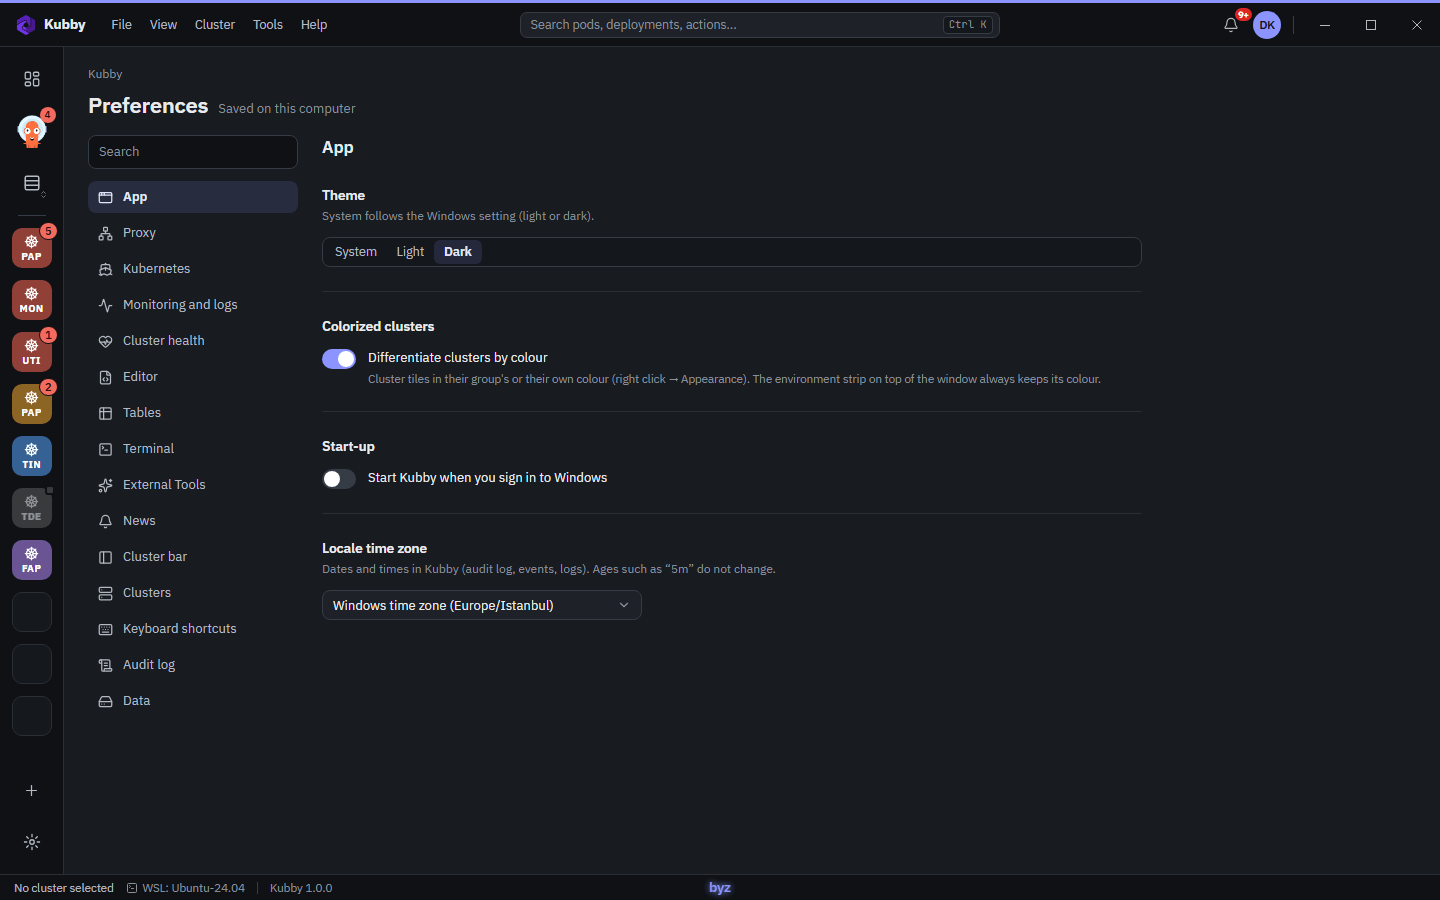
| Section | Contents |
|---|---|
| App | Theme, cluster colours, start Kubby with Windows, time zone for dates and times. |
| Proxy | HTTP proxy for update checks, news and Helm repositories. Clusters use the proxy-url in their kubeconfig. |
| Kubernetes | Kubeconfig sync, Helm repositories, bundled kubectl and helm. |
| Monitoring and logs | Log stores, central stores, metrics, Installed by Kubby. |
| Cluster health | Namespaces left out, allowed registries. |
| Editor, Tables, Terminal | Editor and terminal fonts and sizes, table row height, default terminal, copy and paste. |
| External Tools | AI connections and Enable Ask Kubby. |
| News | News sources and refresh interval. |
| Cluster bar, Clusters | Favorites, groups, environments; added clusters. |
| Keyboard shortcuts | Every shortcut. |
| Audit log | Audit log settings and shipping. |
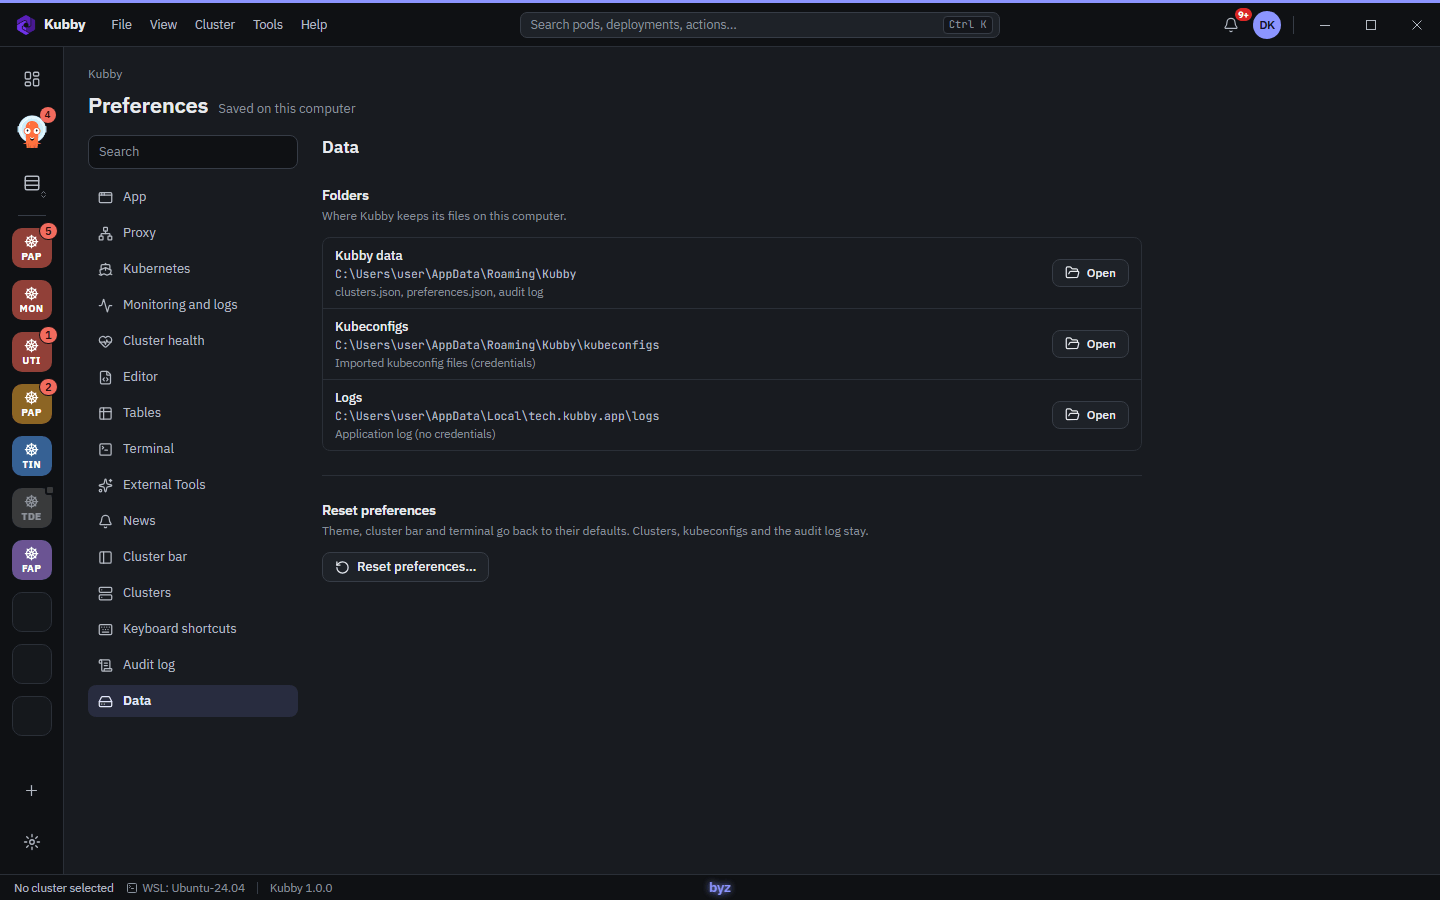
| Data | Kubby's folders and Reset preferences…. |
7. Updates and help
7.1 Updates
Kubby checks kubby.tech for a new release at start and every hour. When there is one, a banner says Kubby <version> is available.
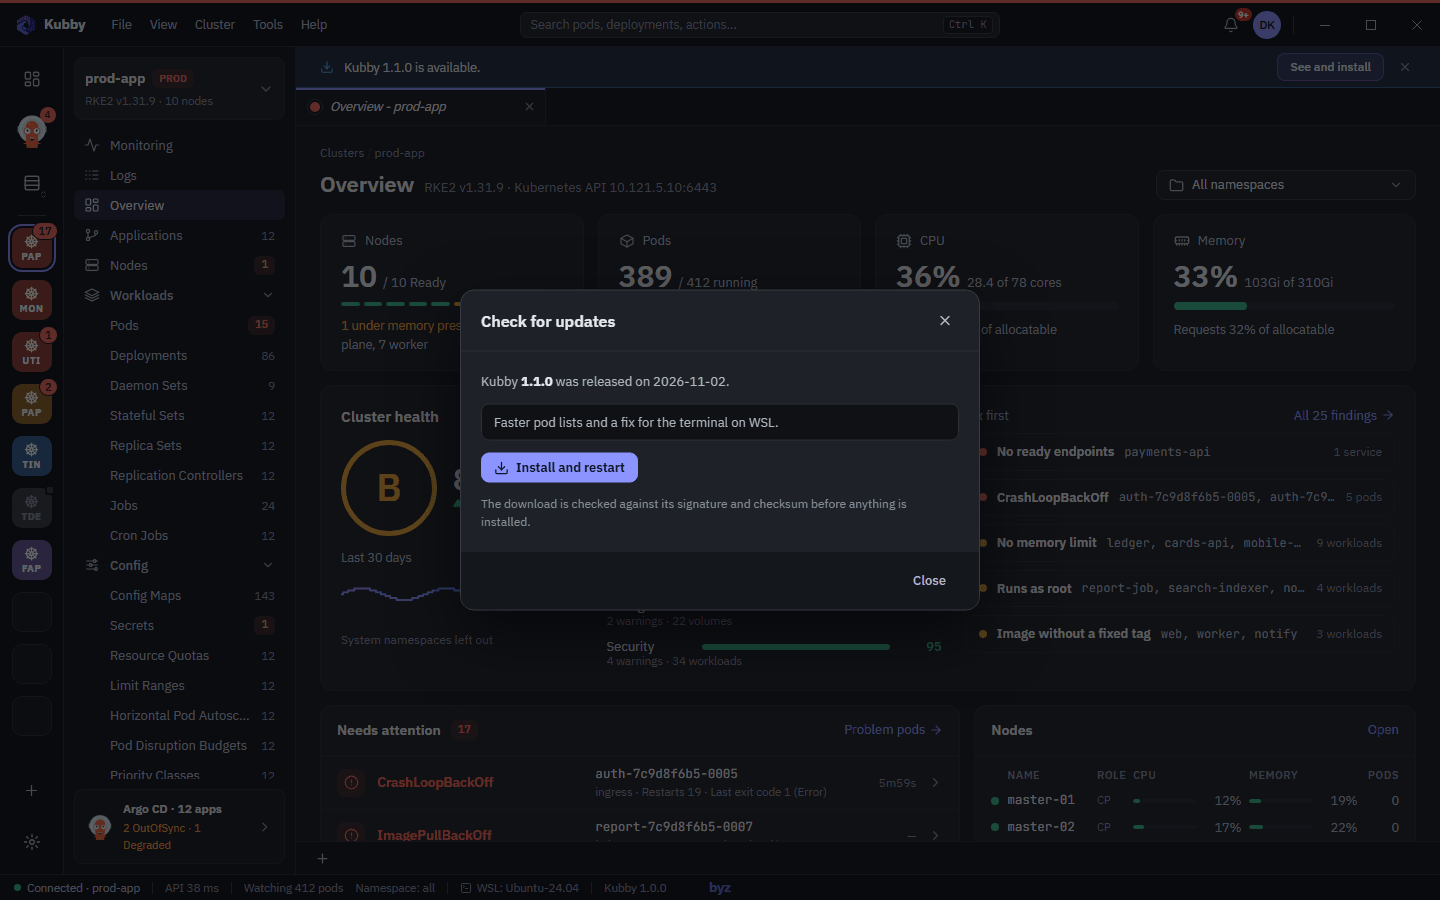
- Click See and install on the banner, or Help → Check for Updates….
- Read the version, date and notes.
- Click Install and restart. Kubby downloads the update, checks it against Kubby's signature and checksum (a file that does not match is not installed), installs it and restarts.
Without internet Kubby works as usual; it only cannot see new releases. Behind a proxy, set Preferences → Proxy. Your version is in the profile menu and the status bar.
7.2 Troubleshooting Kubby
Preferences → Data opens Kubby's folders: data, kubeconfigs and the application logs (last 5 days, no tokens or passwords).
| Problem | What to do |
|---|---|
| A cluster shows "Unreachable" | Check VPN and firewall to the API address. The connection uses the kubeconfig (including proxy-url), not Preferences → Proxy. If the token expired, get a fresh kubeconfig and add or edit the cluster again. |
| "No Prometheus found in this cluster" | Install Rancher Monitoring, kube-prometheus-stack or the prometheus chart, or use Set up monitoring. You need get on services/proxy. Empty panels mean those metrics are not collected; the panel says so. |
| Argo CD connection test fails | "Argo CD's TLS certificate was not accepted": add its CA certificate. 401 / 403: create a new token. |
| No Ask Kubby button | In Preferences → External Tools, check that the connection shows Connected (CLI tools must be installed and signed in), then turn on Enable Ask Kubby. |
| The authenticator code is refused | Let your phone set its clock automatically. Without your phone, use Use a recovery code. |
| Setup is blocked | More info → Run anyway, or ask IT to allow the file by its SHA-256 hash (1.2). |
Support: write to [email protected] with your Kubby version (profile menu or status bar), your Windows version and the steps to reproduce. The application logs are in the logs folder of Preferences → Data.