Overview and problems
Overview sums up the open cluster on one screen: the whole cluster at the top, then one node in detail, then every node, the latest events and the problems.
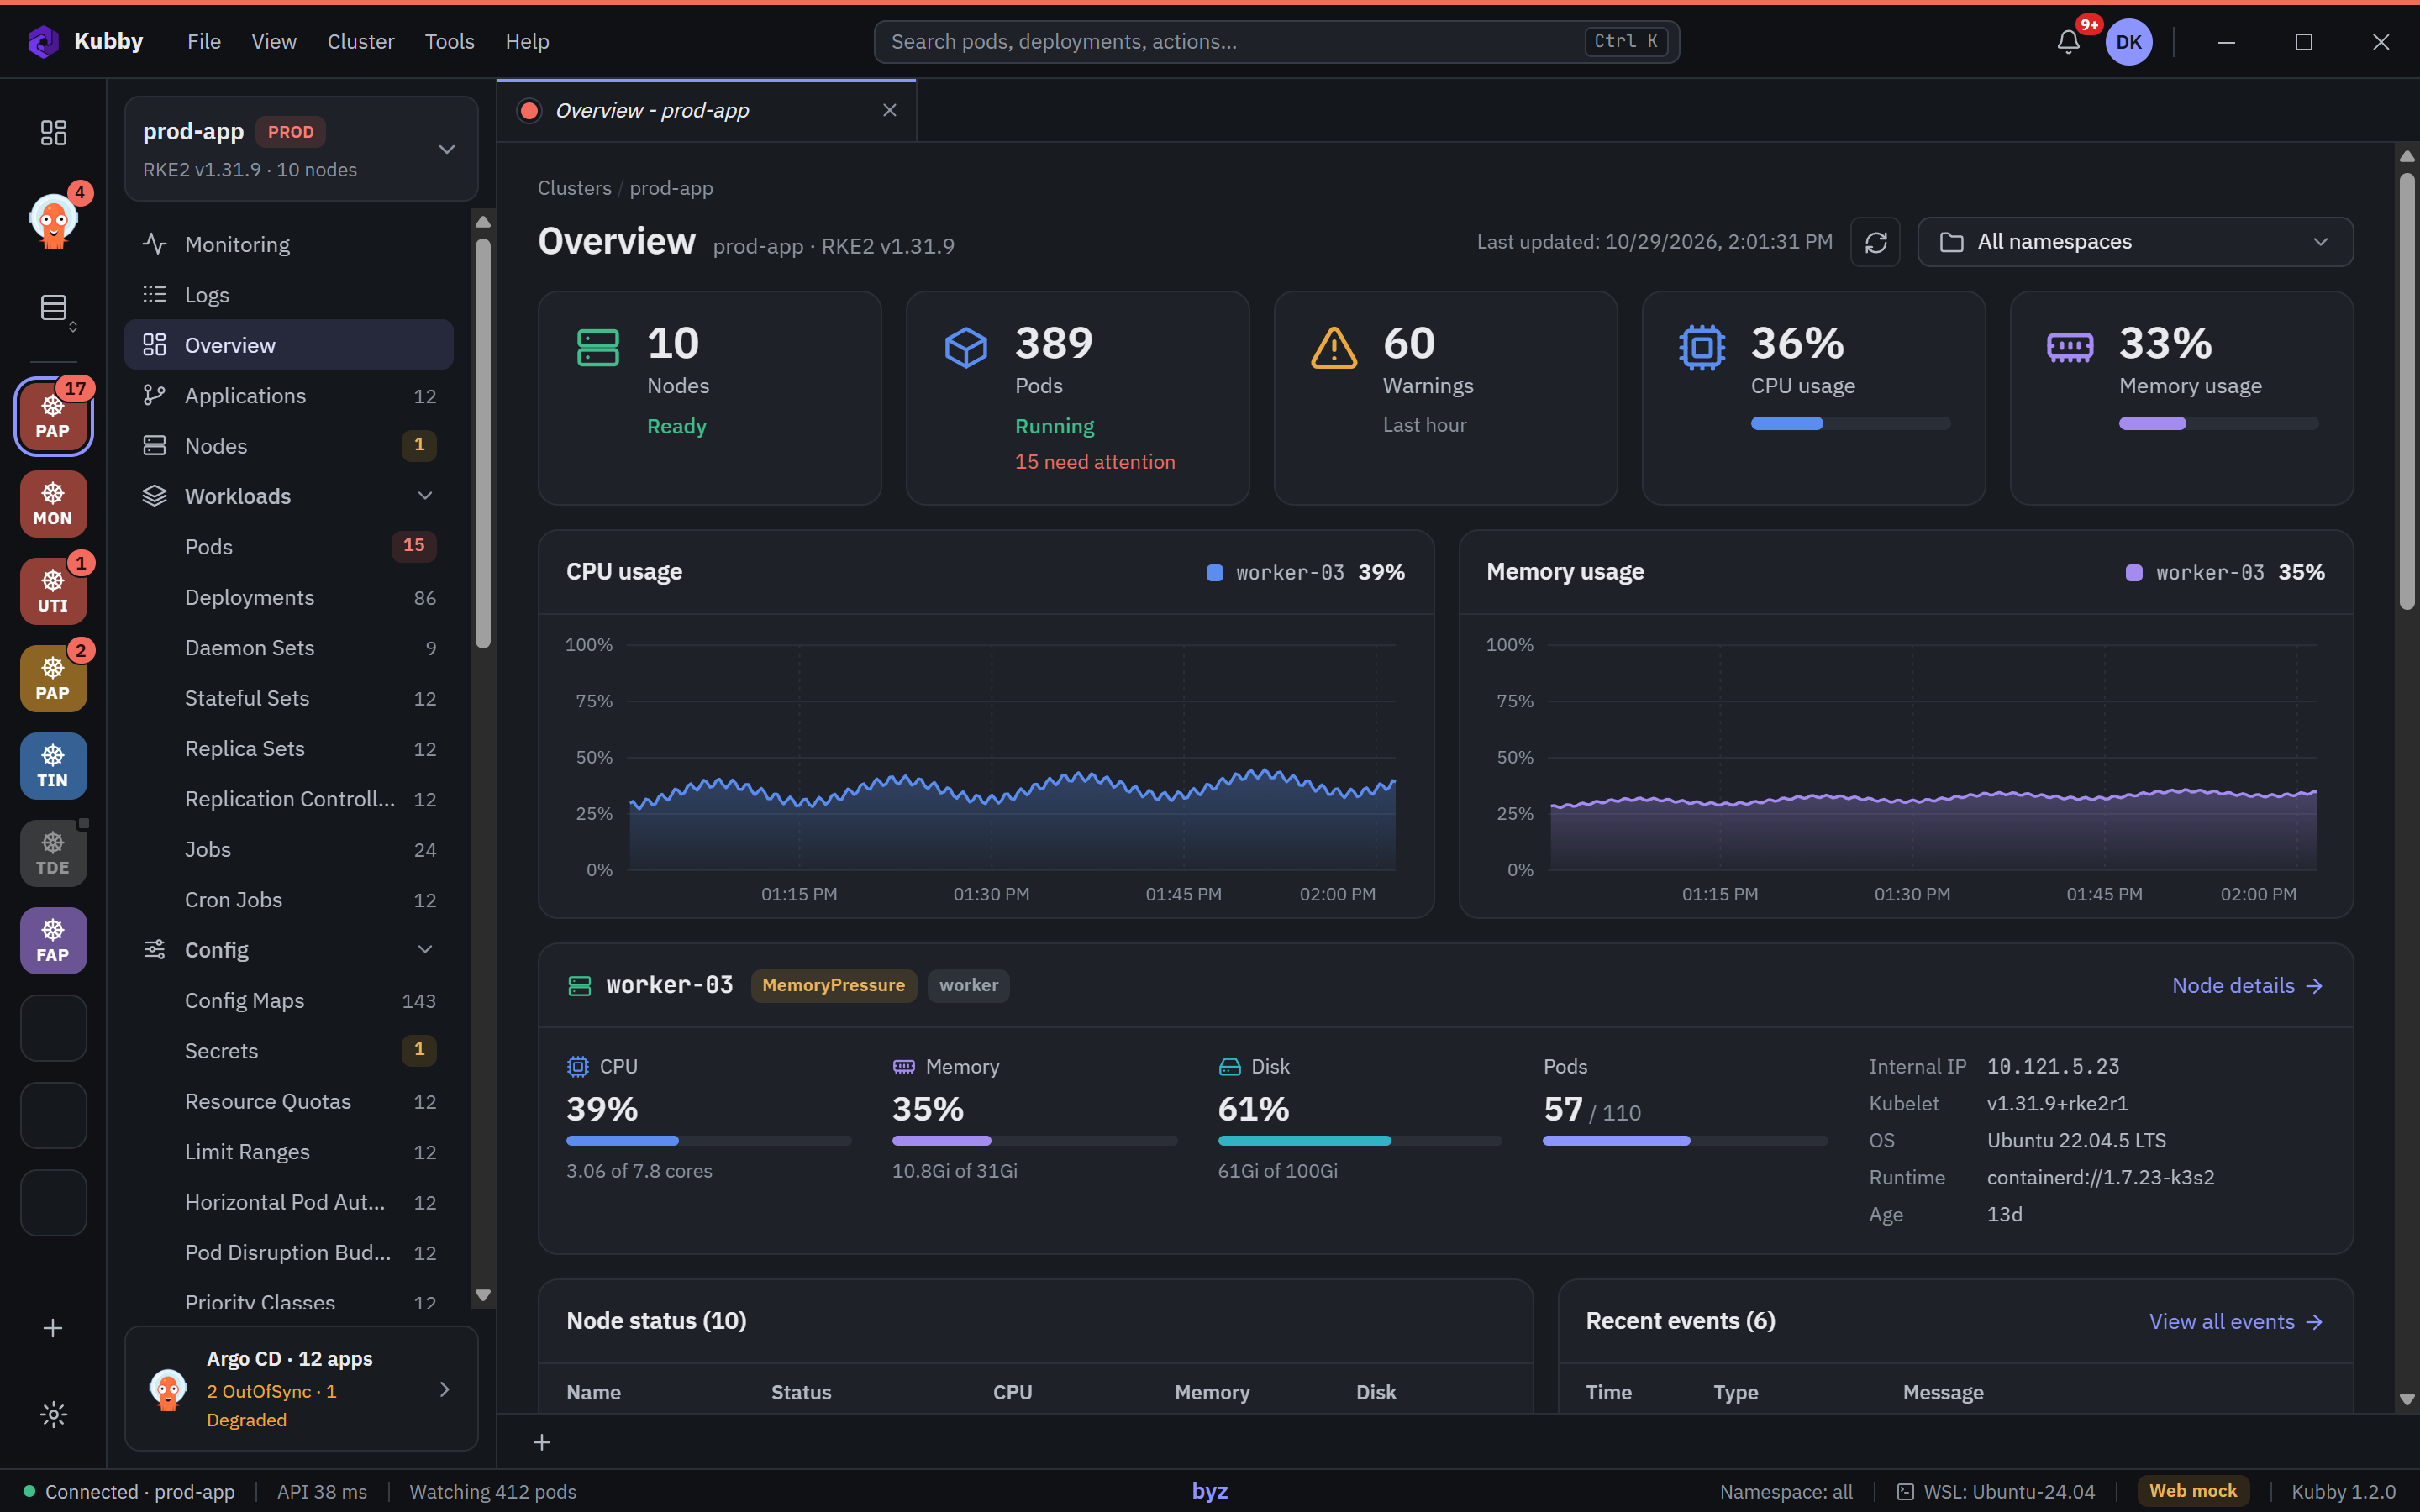
Summary cards
- Nodes: how many there are and whether all are ready.
- Pods: running pods and how many need attention.
- Warnings: Warning events of the last hour.
- CPU usage and Memory usage: cluster-wide usage as a share of allocatable (needs metrics-server).
One node in detail
The CPU usage and Memory usage charts show the selected node over the last hour, as a share of its allocatable. At first the first node is selected (control planes first, then by name); click a row in Node status to pick another.
The node's card under the charts shows its CPU, memory, disk and pods, with its address, kubelet, OS and container runtime. Node details opens it in the Nodes list.
- History: metrics-server keeps no history, so Kubby records the usage while the cluster is open. The charts fill over the first hour.
- Disk: the node's root file system (where the kubelet, logs and emptyDir volumes live) from the kubelet's summary, read once a minute through the API server. It needs the
nodes/proxypermission; without it the card says so. When the container images live on a separate disk, its usage is shown too.
Node status and recent events
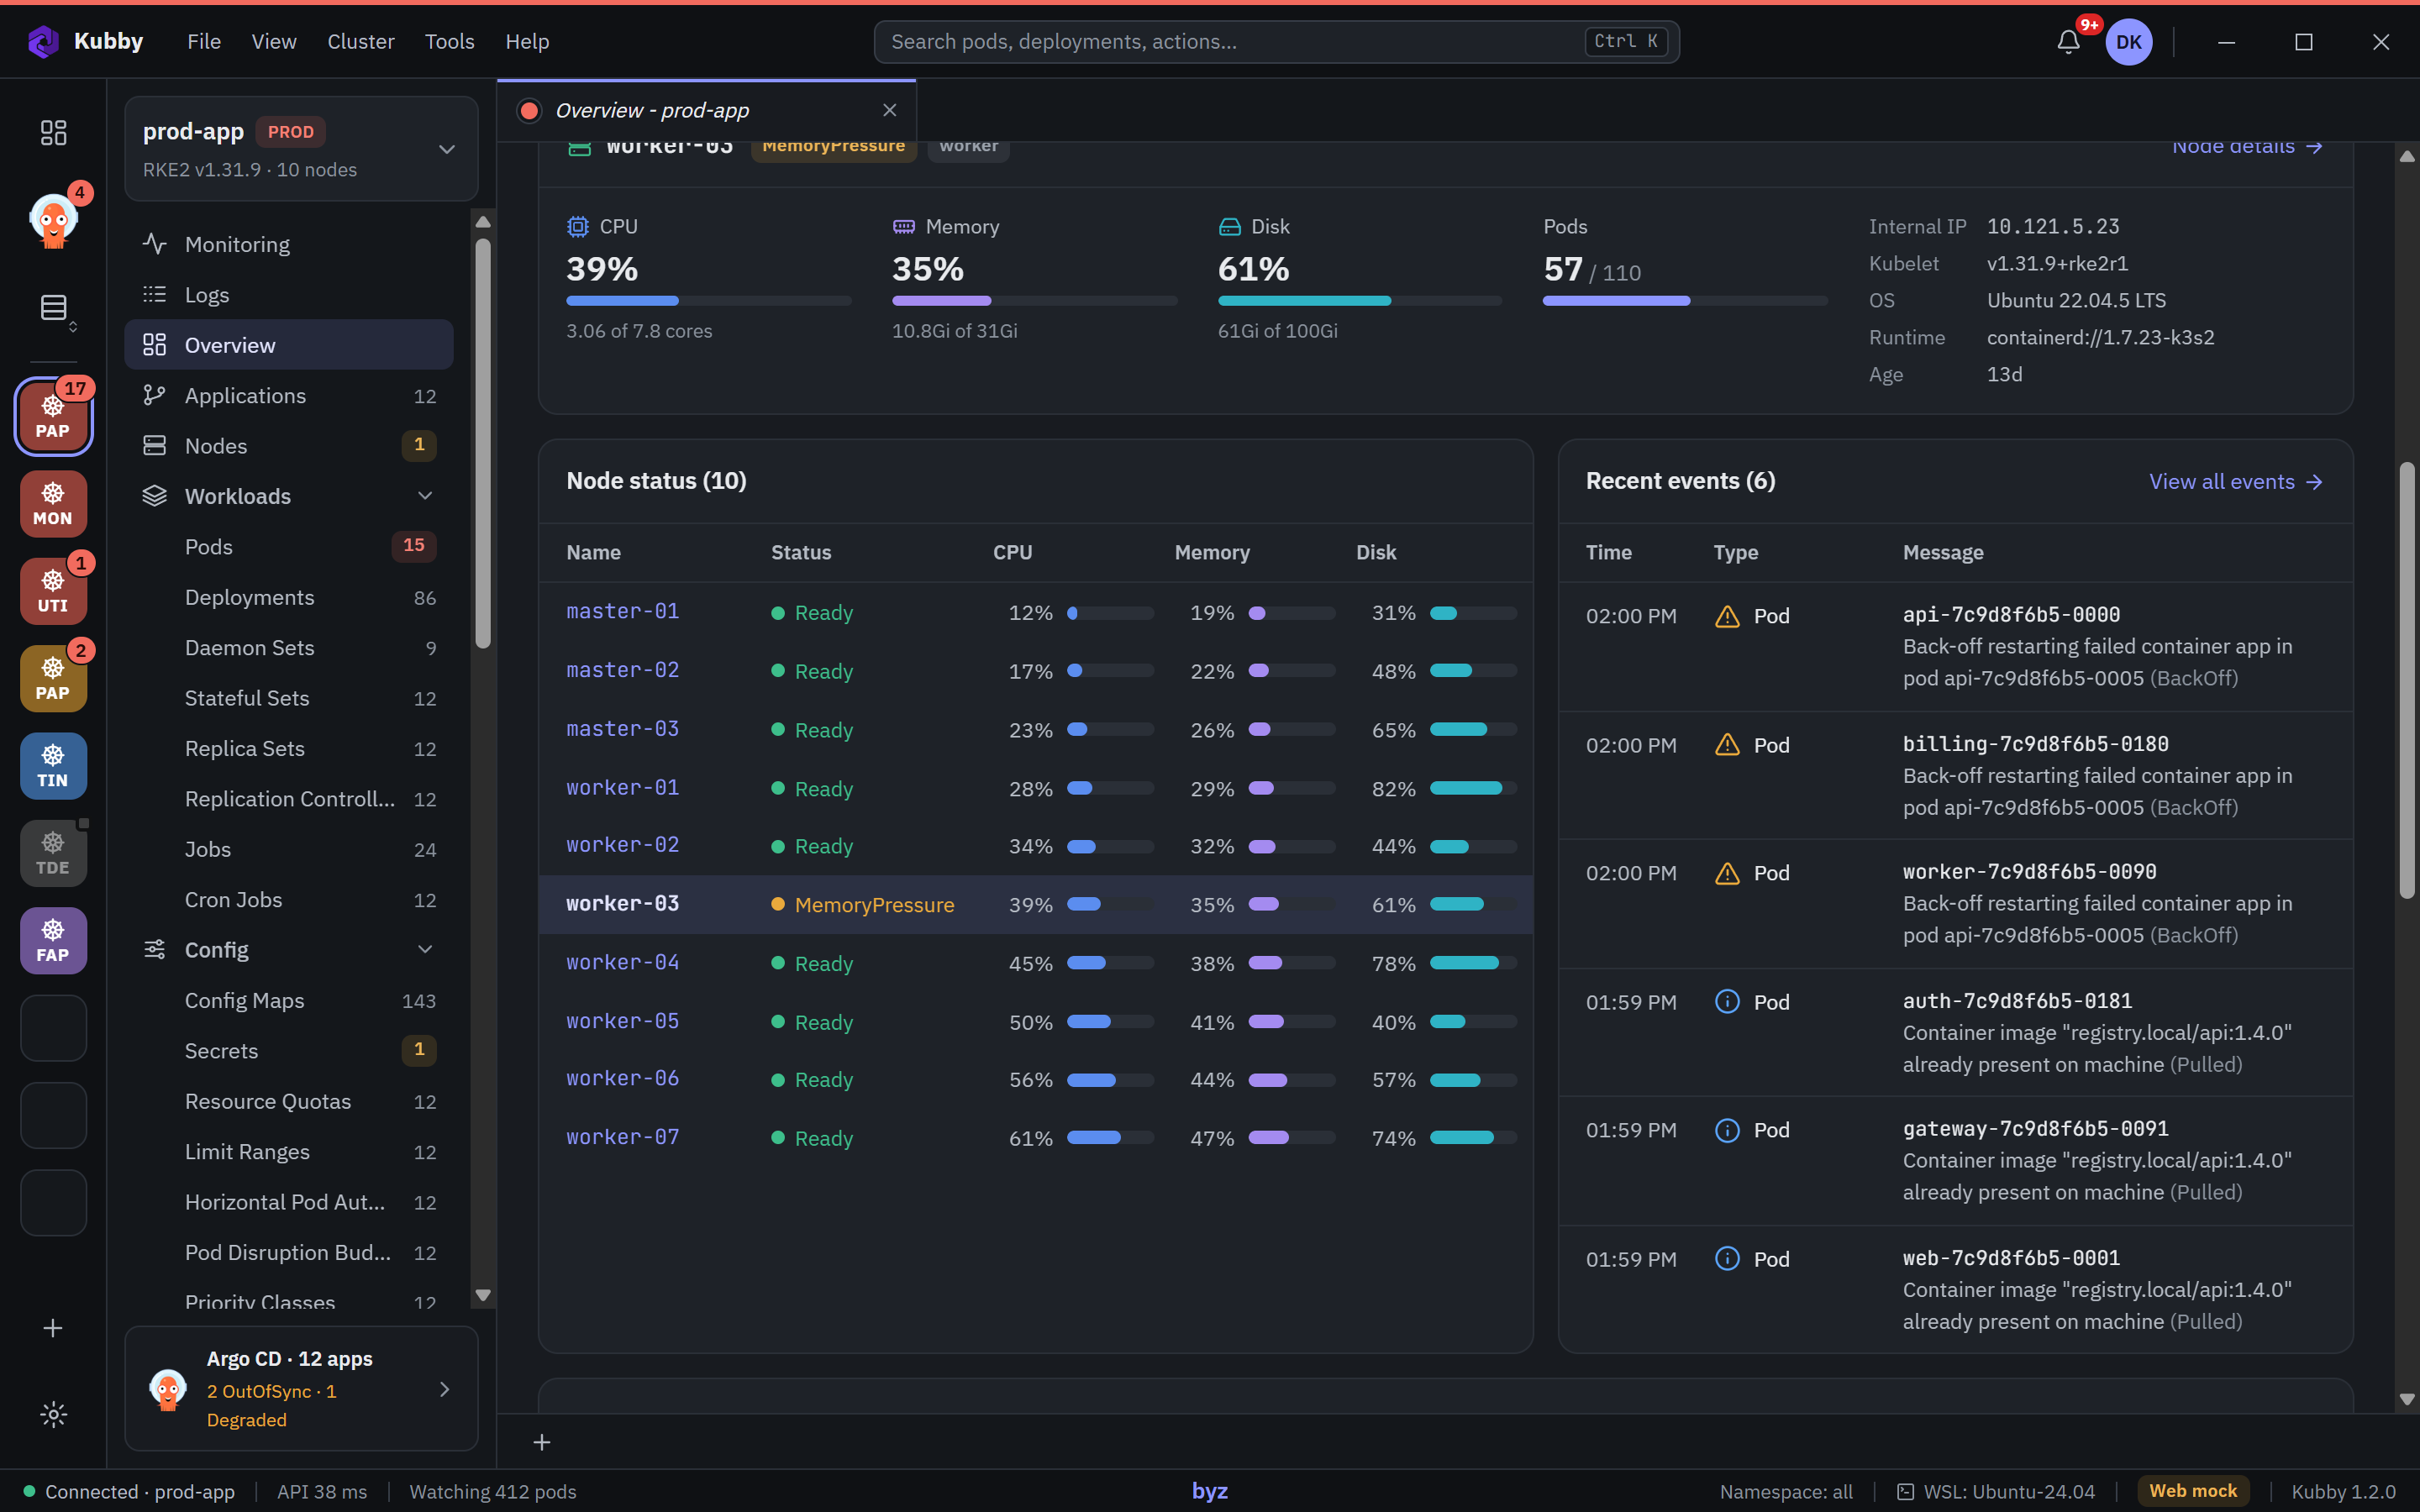
Node status lists every node with its state and its CPU, memory and disk usage and pods. Recent events shows the newest events with their time, kind and message; View all events opens the Events list.
Cluster health
A Cluster health card under the node status grades the cluster from A to F, scores each area and lists what to fix first. See Cluster health score.
Needs attention
The "Needs attention" list, under Cluster health, shows the problems Kubby recognises:
- CrashLoopBackOff, ImagePullBackOff, OOMKilled;
- pods that wait too long or cannot be placed (Pending, Unschedulable);
- failed Jobs and workloads that are not ready.
Each row carries a short explanation such as the restart count, the last exit code or the memory limit. Click a row to open the resource.
Step-by-step guides: CrashLoopBackOff, OOMKilled, ImagePullBackOff, Pending pods.
"Why?" explanations
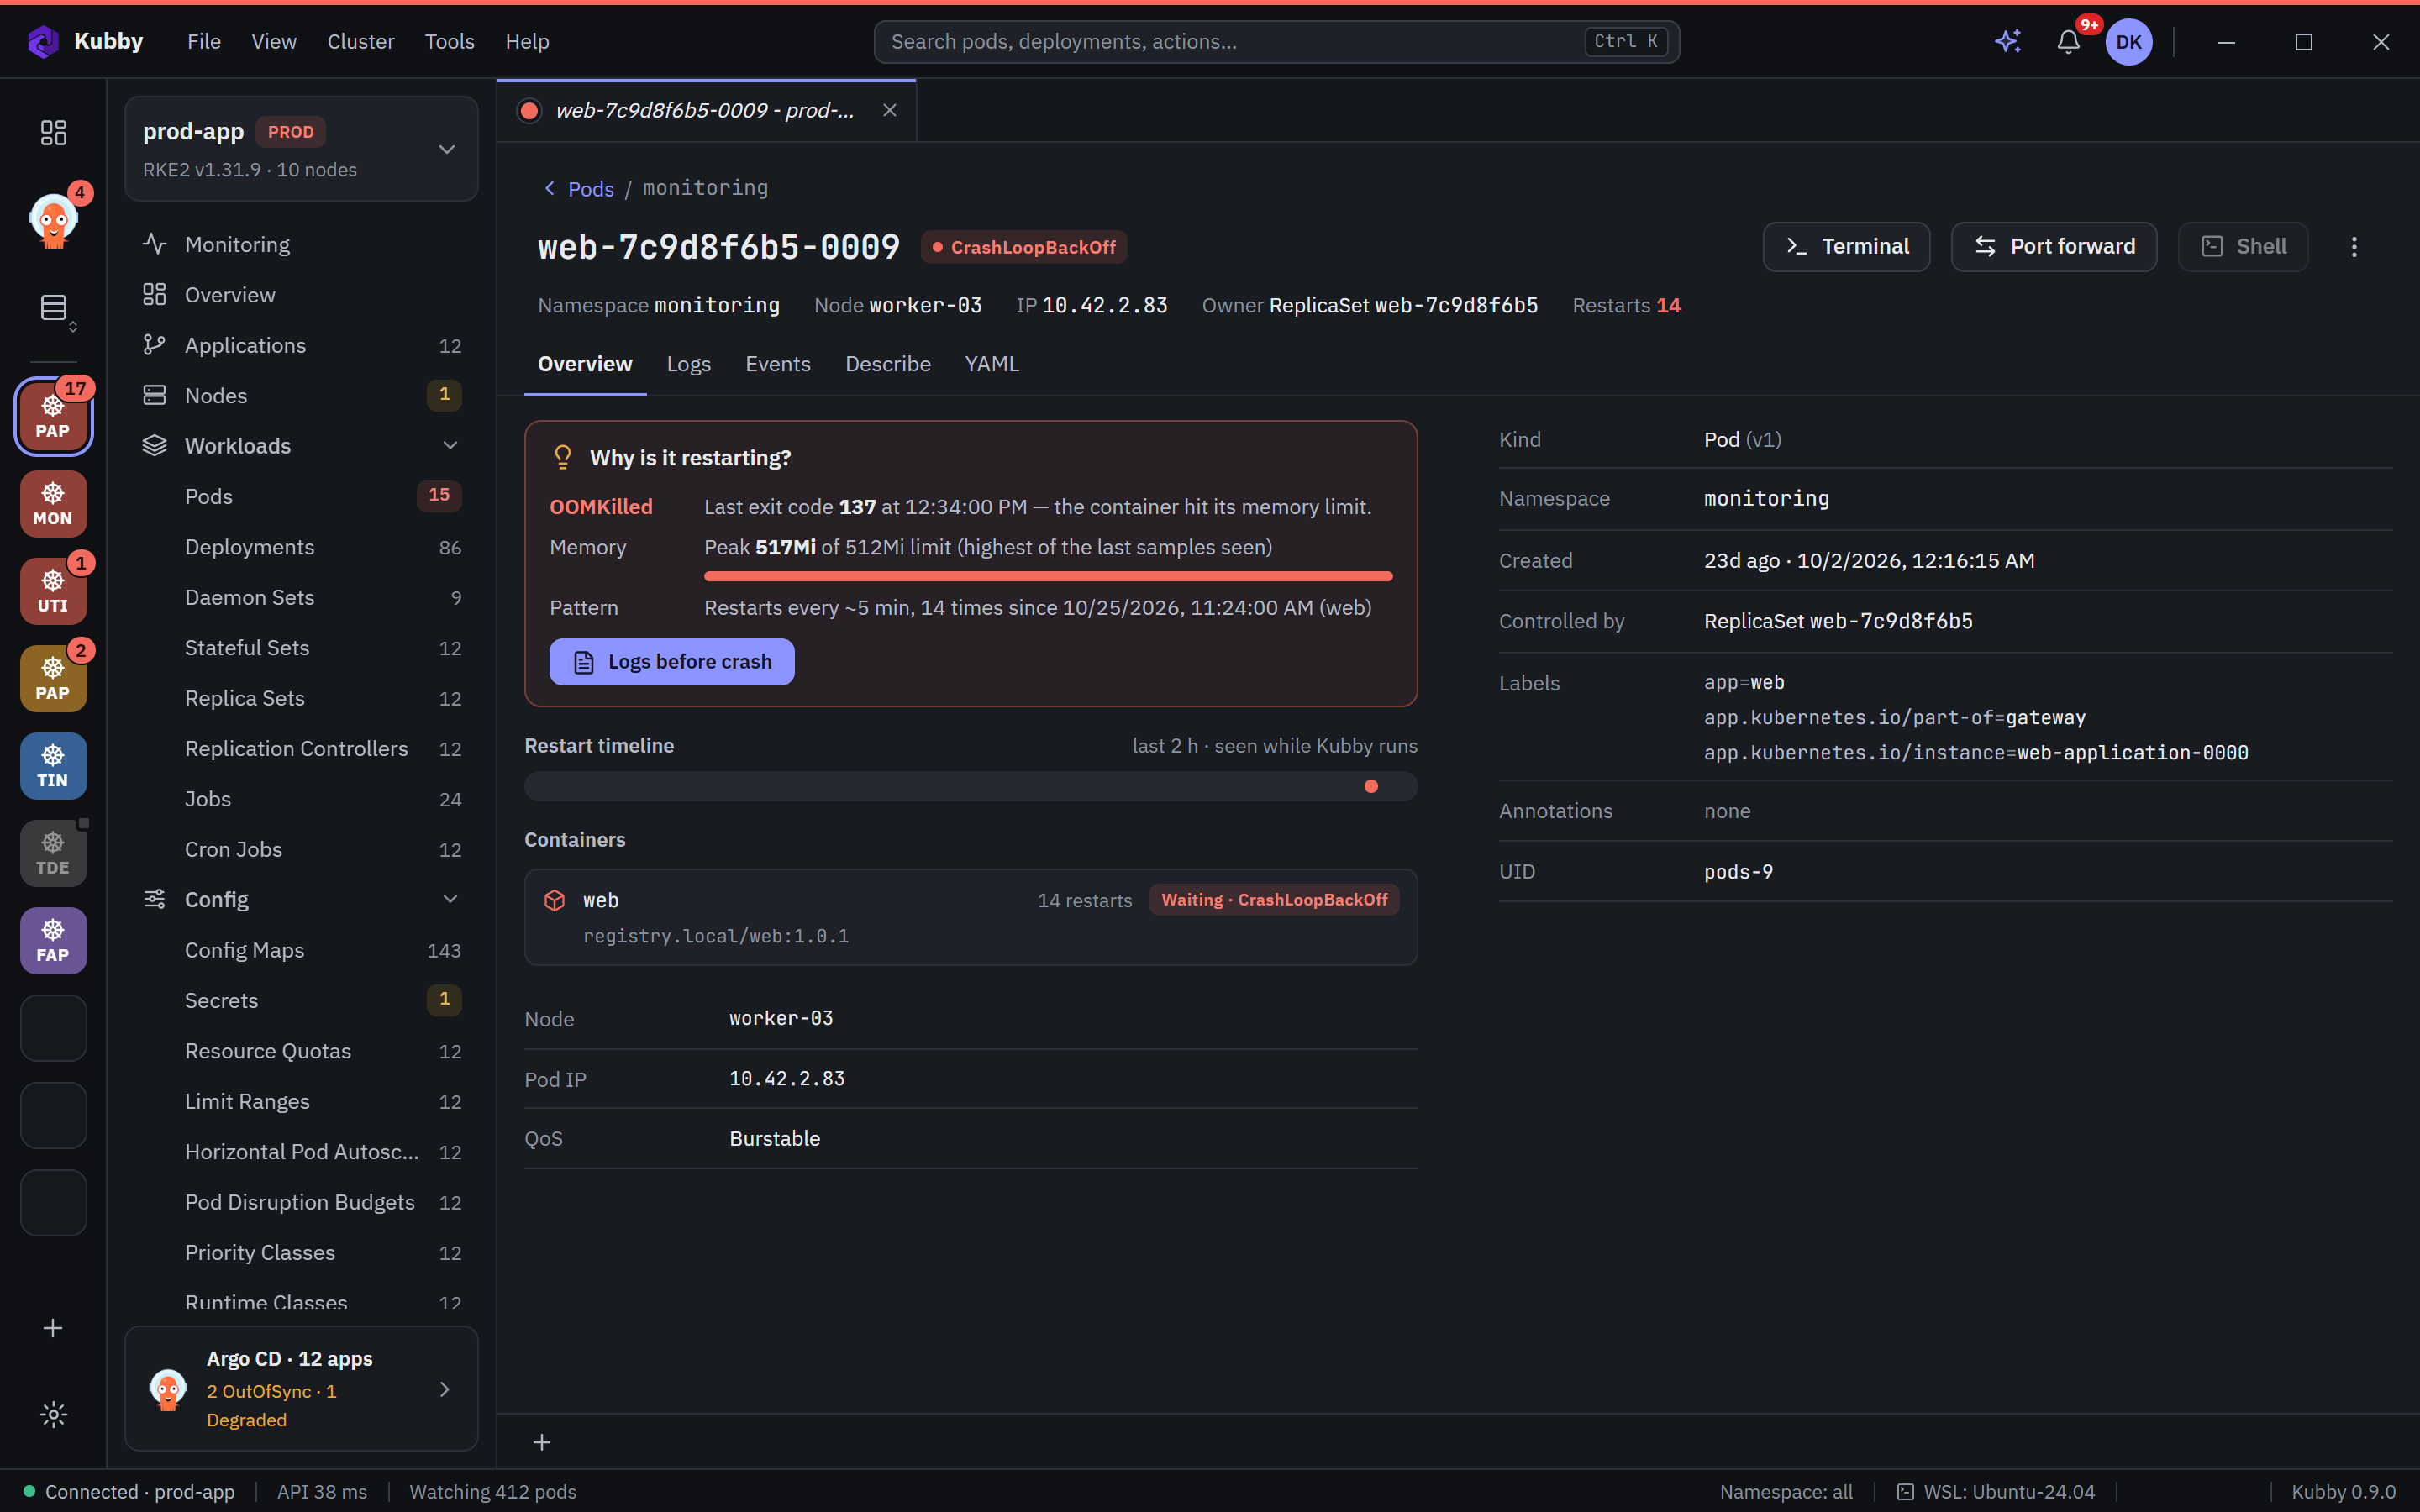
For a restarting pod, Kubby works out the reason: the last exit code, for OOMKilled the memory limit and the highest usage seen, the restart pattern and a link to the logs before the crash.
Namespace selection
Pick one or more namespaces with the namespace picker at the top. The choice is remembered per cluster.