Logs page
The Logs page shows the logs of every pod and container you pick in one live timeline, with pod starts, kills and events between the lines.
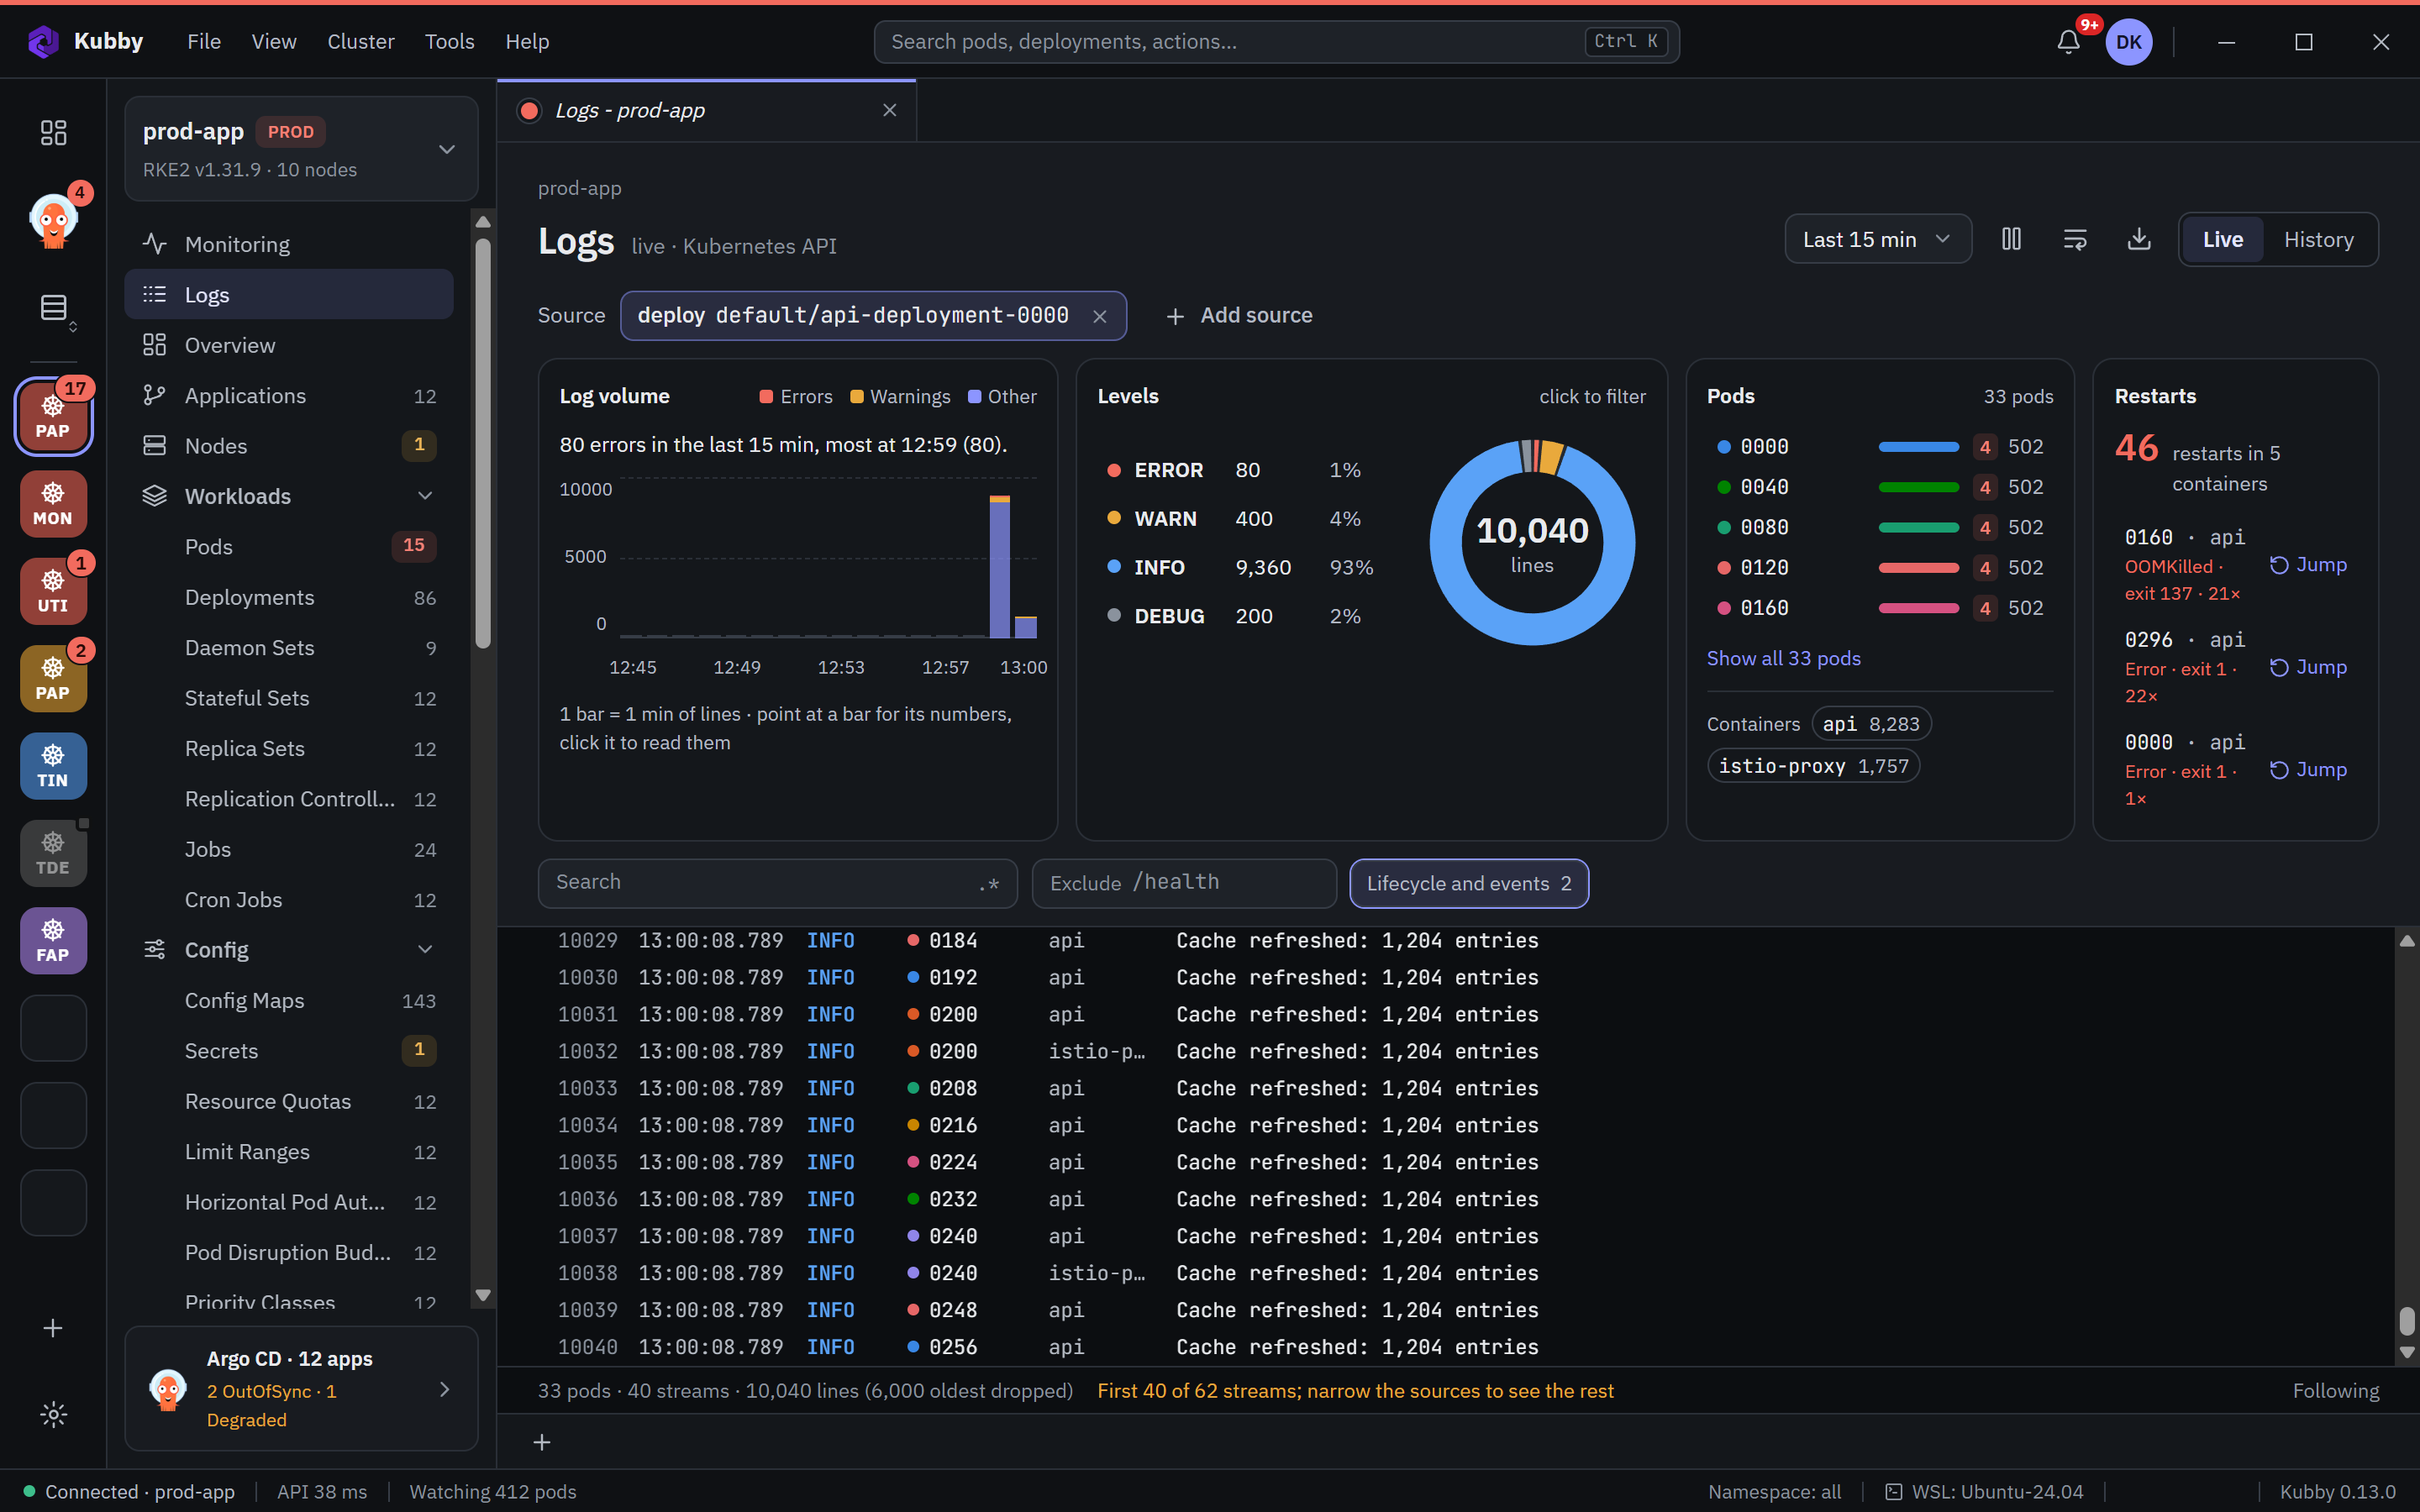
Choosing what to read
Open Logs in the navigator, right below Monitoring, and press Add source. A source can be:
- A workload: a Deployment, StatefulSet, DaemonSet or CronJob.
- A label selector: for example
app.kubernetes.io/part-of=gateway, in one namespace or all of them. - A namespace or a single pod.
Add as many sources as you need; a pod that two sources select is read once. Kubby keeps your sources when you leave the page and lists the recent ones on the empty page. You can also open the page from a workload's right-click menu, its Logs action or the command palette.
New pods appear without a reload: scale a Deployment and the new pod's lines join the timeline. A deleted pod's lines stay where they are.
Summary cards
- Log volume: lines over time, errors and warnings in colour. Point at a bar for its numbers, click it to read that minute.
- Levels: ERROR, WARN, INFO and DEBUG with counts; click one to filter.
- Pods: the busiest pods and their containers. Click a pod or container to hide its lines.
- Restarts: containers that restarted, with the reason (for example OOMKilled, exit 137) and Jump.
Filters
- Search keeps matching lines and highlights the match; .* switches to a regular expression.
- Exclude hides lines with a text, for example
/health. - Lifecycle and events shows or hides the pod and event rows.
- Node, zone and architecture filters appear when your nodes have more than one value.
Jump to the crash
Jump on a restart sets the time range to five minutes before the crash and one minute after, pauses following and adds the crashed run's lines, marked "(previous)". Kubernetes keeps only the last crashed run of a container; with a log store Kubby can read older ones.
Time range and download
Pick a recent range such as Last 15 min, or a custom range from a start to an end. Scrolling up pauses following; scrolling to the bottom starts it again. Download saves the lines shown, with your filters applied.
Limits
To stay fast on large clusters, the page reads up to 40 streams at a time and keeps the newest 10,000 lines. The status line says when sources were cut; narrow them to see the rest.