Setting up logs and metrics
Kubby needs nothing in your clusters. If a cluster has no log store or Prometheus and you want one, Kubby can set it up for you, after showing what it costs.
When Kubby offers it
On a cluster without a log store, the Overview and the History view of the Logs page show Set up logs. On a cluster without Prometheus, Monitoring shows Set up monitoring. Kubby never installs anything by itself: nothing changes until you press Install.
- Logs: Loki (single binary) and Grafana Alloy on every node, in the namespace
kubby-loki. - Monitoring: a small Prometheus for the Monitoring pages.
1. Choices
- Storage: a disk (PVC, with the StorageClass and size) or S3 object storage (endpoint, bucket, region and a Secret with the keys).
- Keep for: 1, 3, 7 or 14 days.
- Images: from the internet, or from your private registry, for example
harbor.bank.local/mirror. - Charts: from the public repositories or your mirror (https:// or oci://).
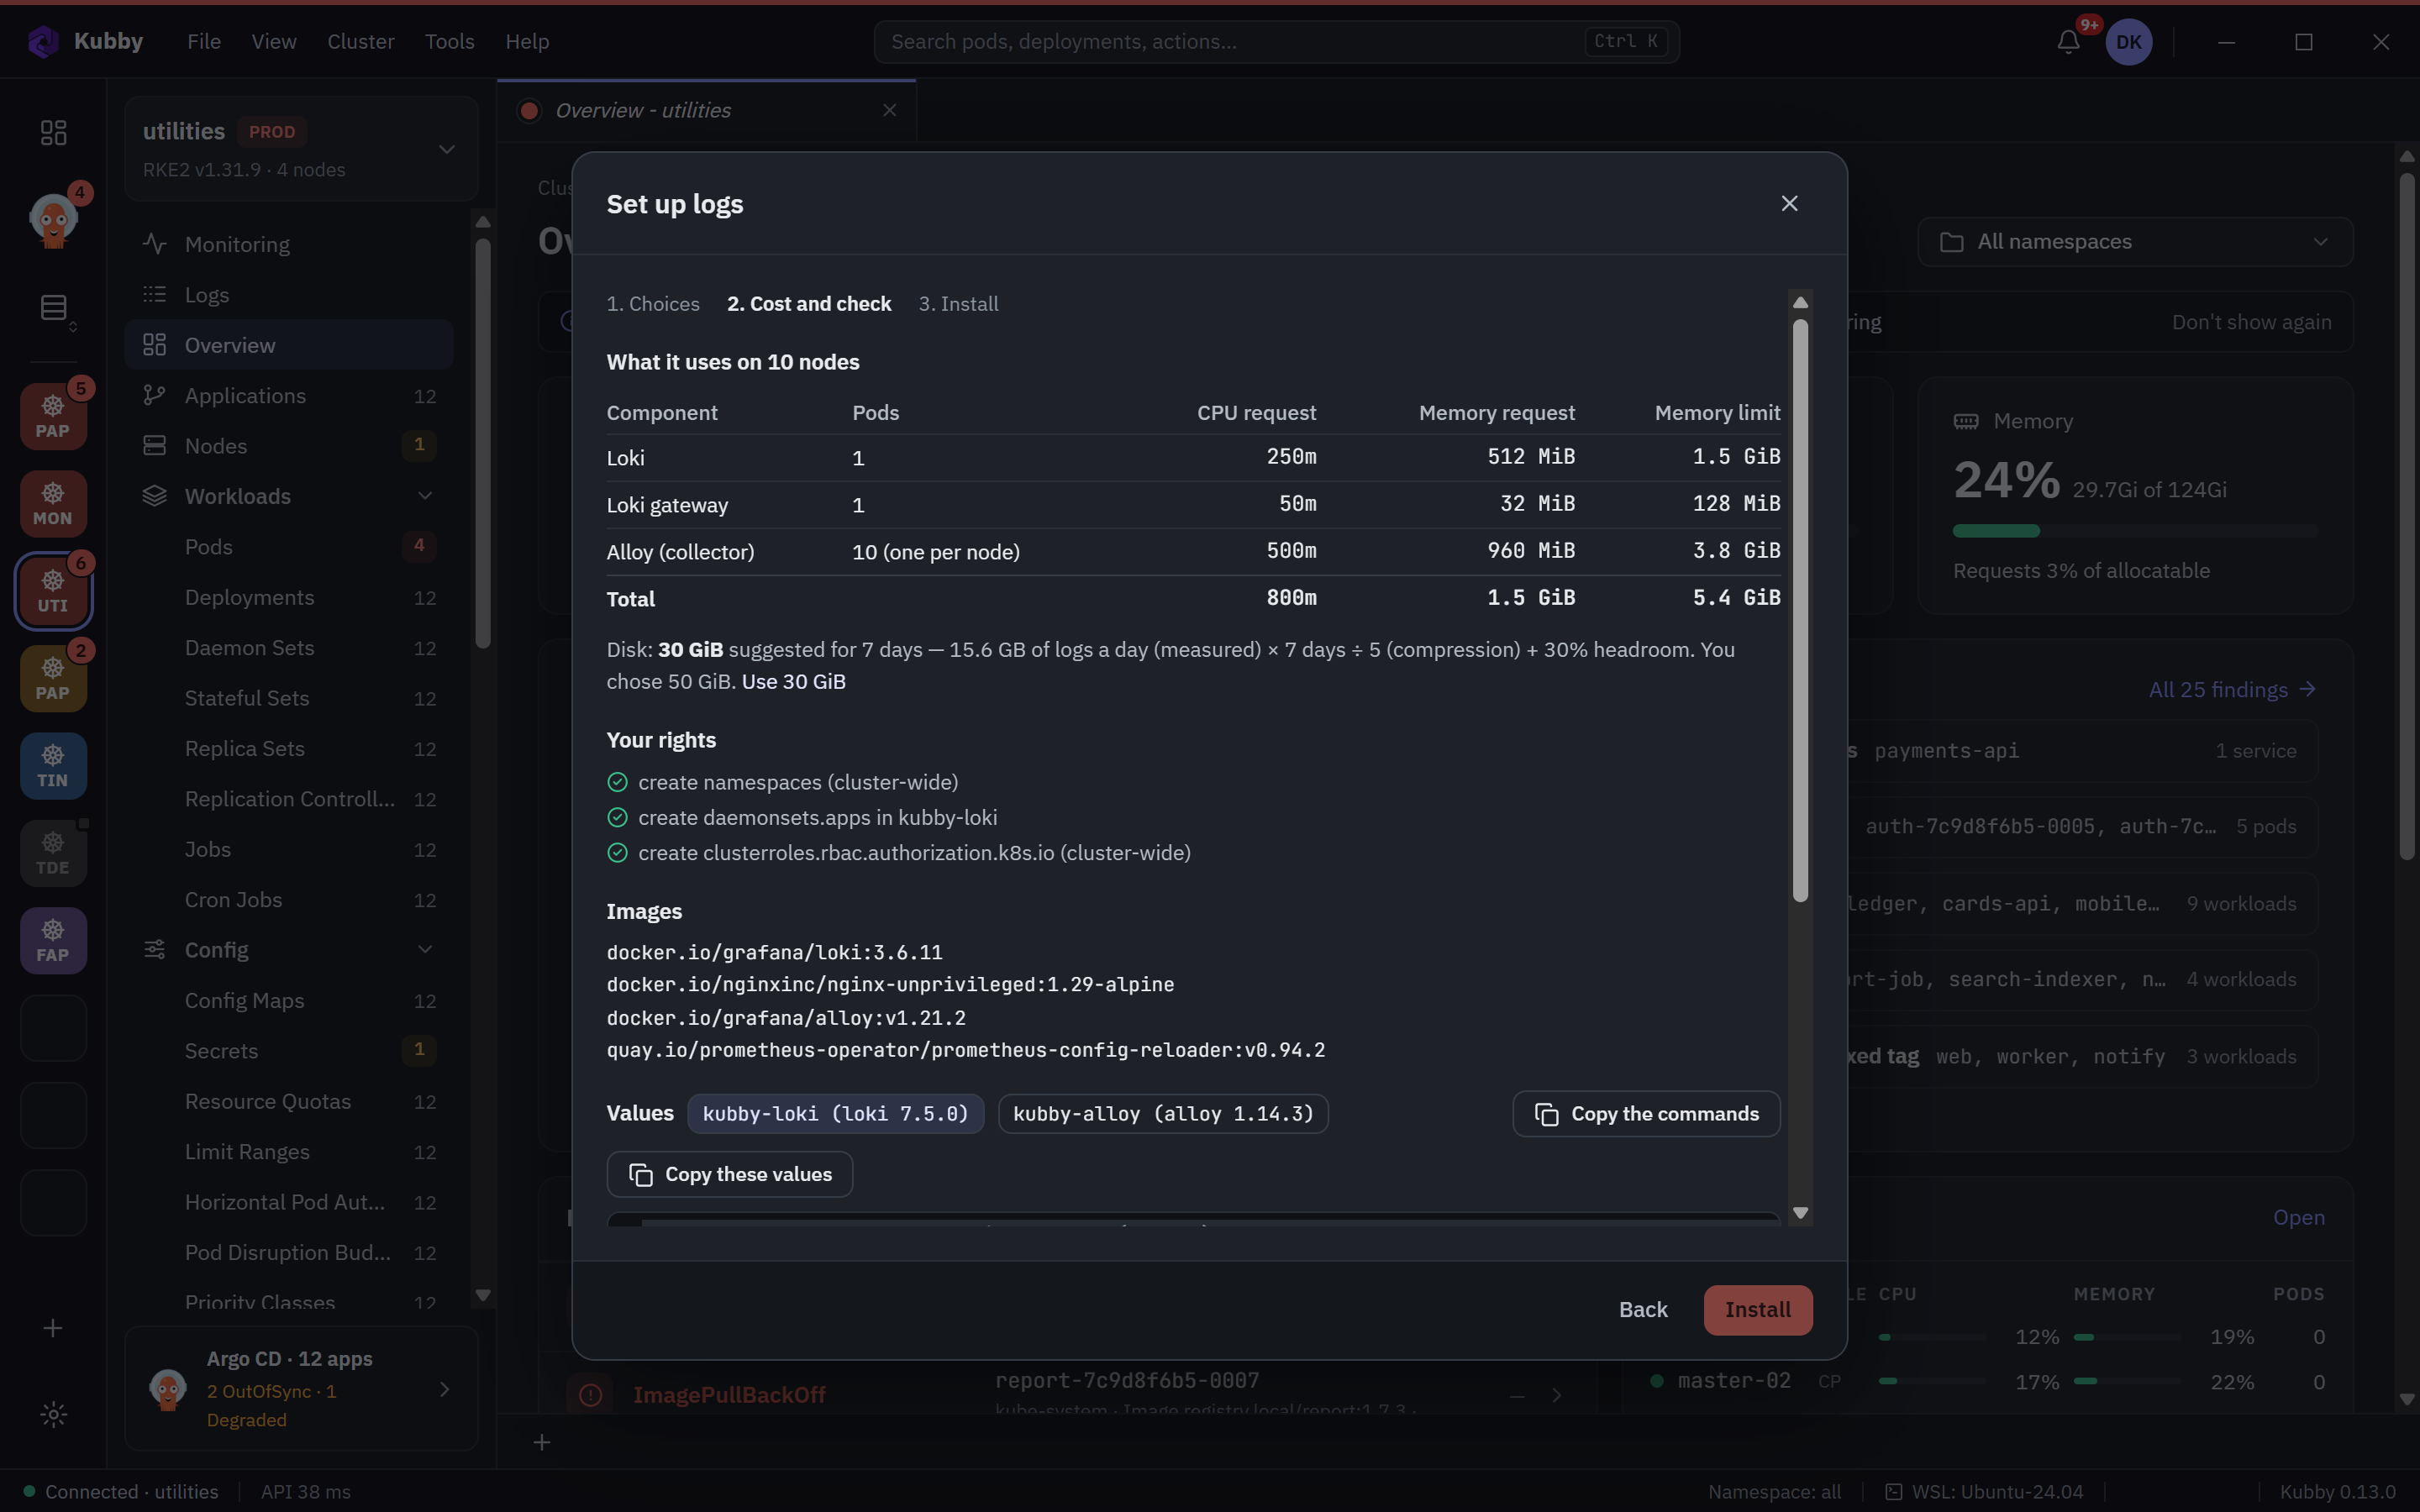
2. Cost and check
Kubby measures the log rate on the nodes for about a minute, then shows:
- What it uses on this cluster's nodes: pods, CPU and memory requests and limits of each component, and the total.
- Disk: a suggested size from the measured rate, how long you keep logs, compression and headroom.
- Your rights: whether your account may create what the install needs.
- Images to pull or to mirror, and the generated Helm values. Copy the commands gives your platform team the same install to run themselves.
3. Install
Helm installs and Kubby waits for the pods. On a PROD cluster you type the cluster name first. The install is written to the audit log, and Kubby connects to the new store or Prometheus by itself.
Installed by Kubby
Preferences → Monitoring and logs → Installed by Kubby lists what Kubby set up, with its pods and resource use.
- Change opens the same steps and upgrades the install.
- Remove uninstalls it. The disks stay, unless you also choose to delete the namespace and its disks.