Interface tour
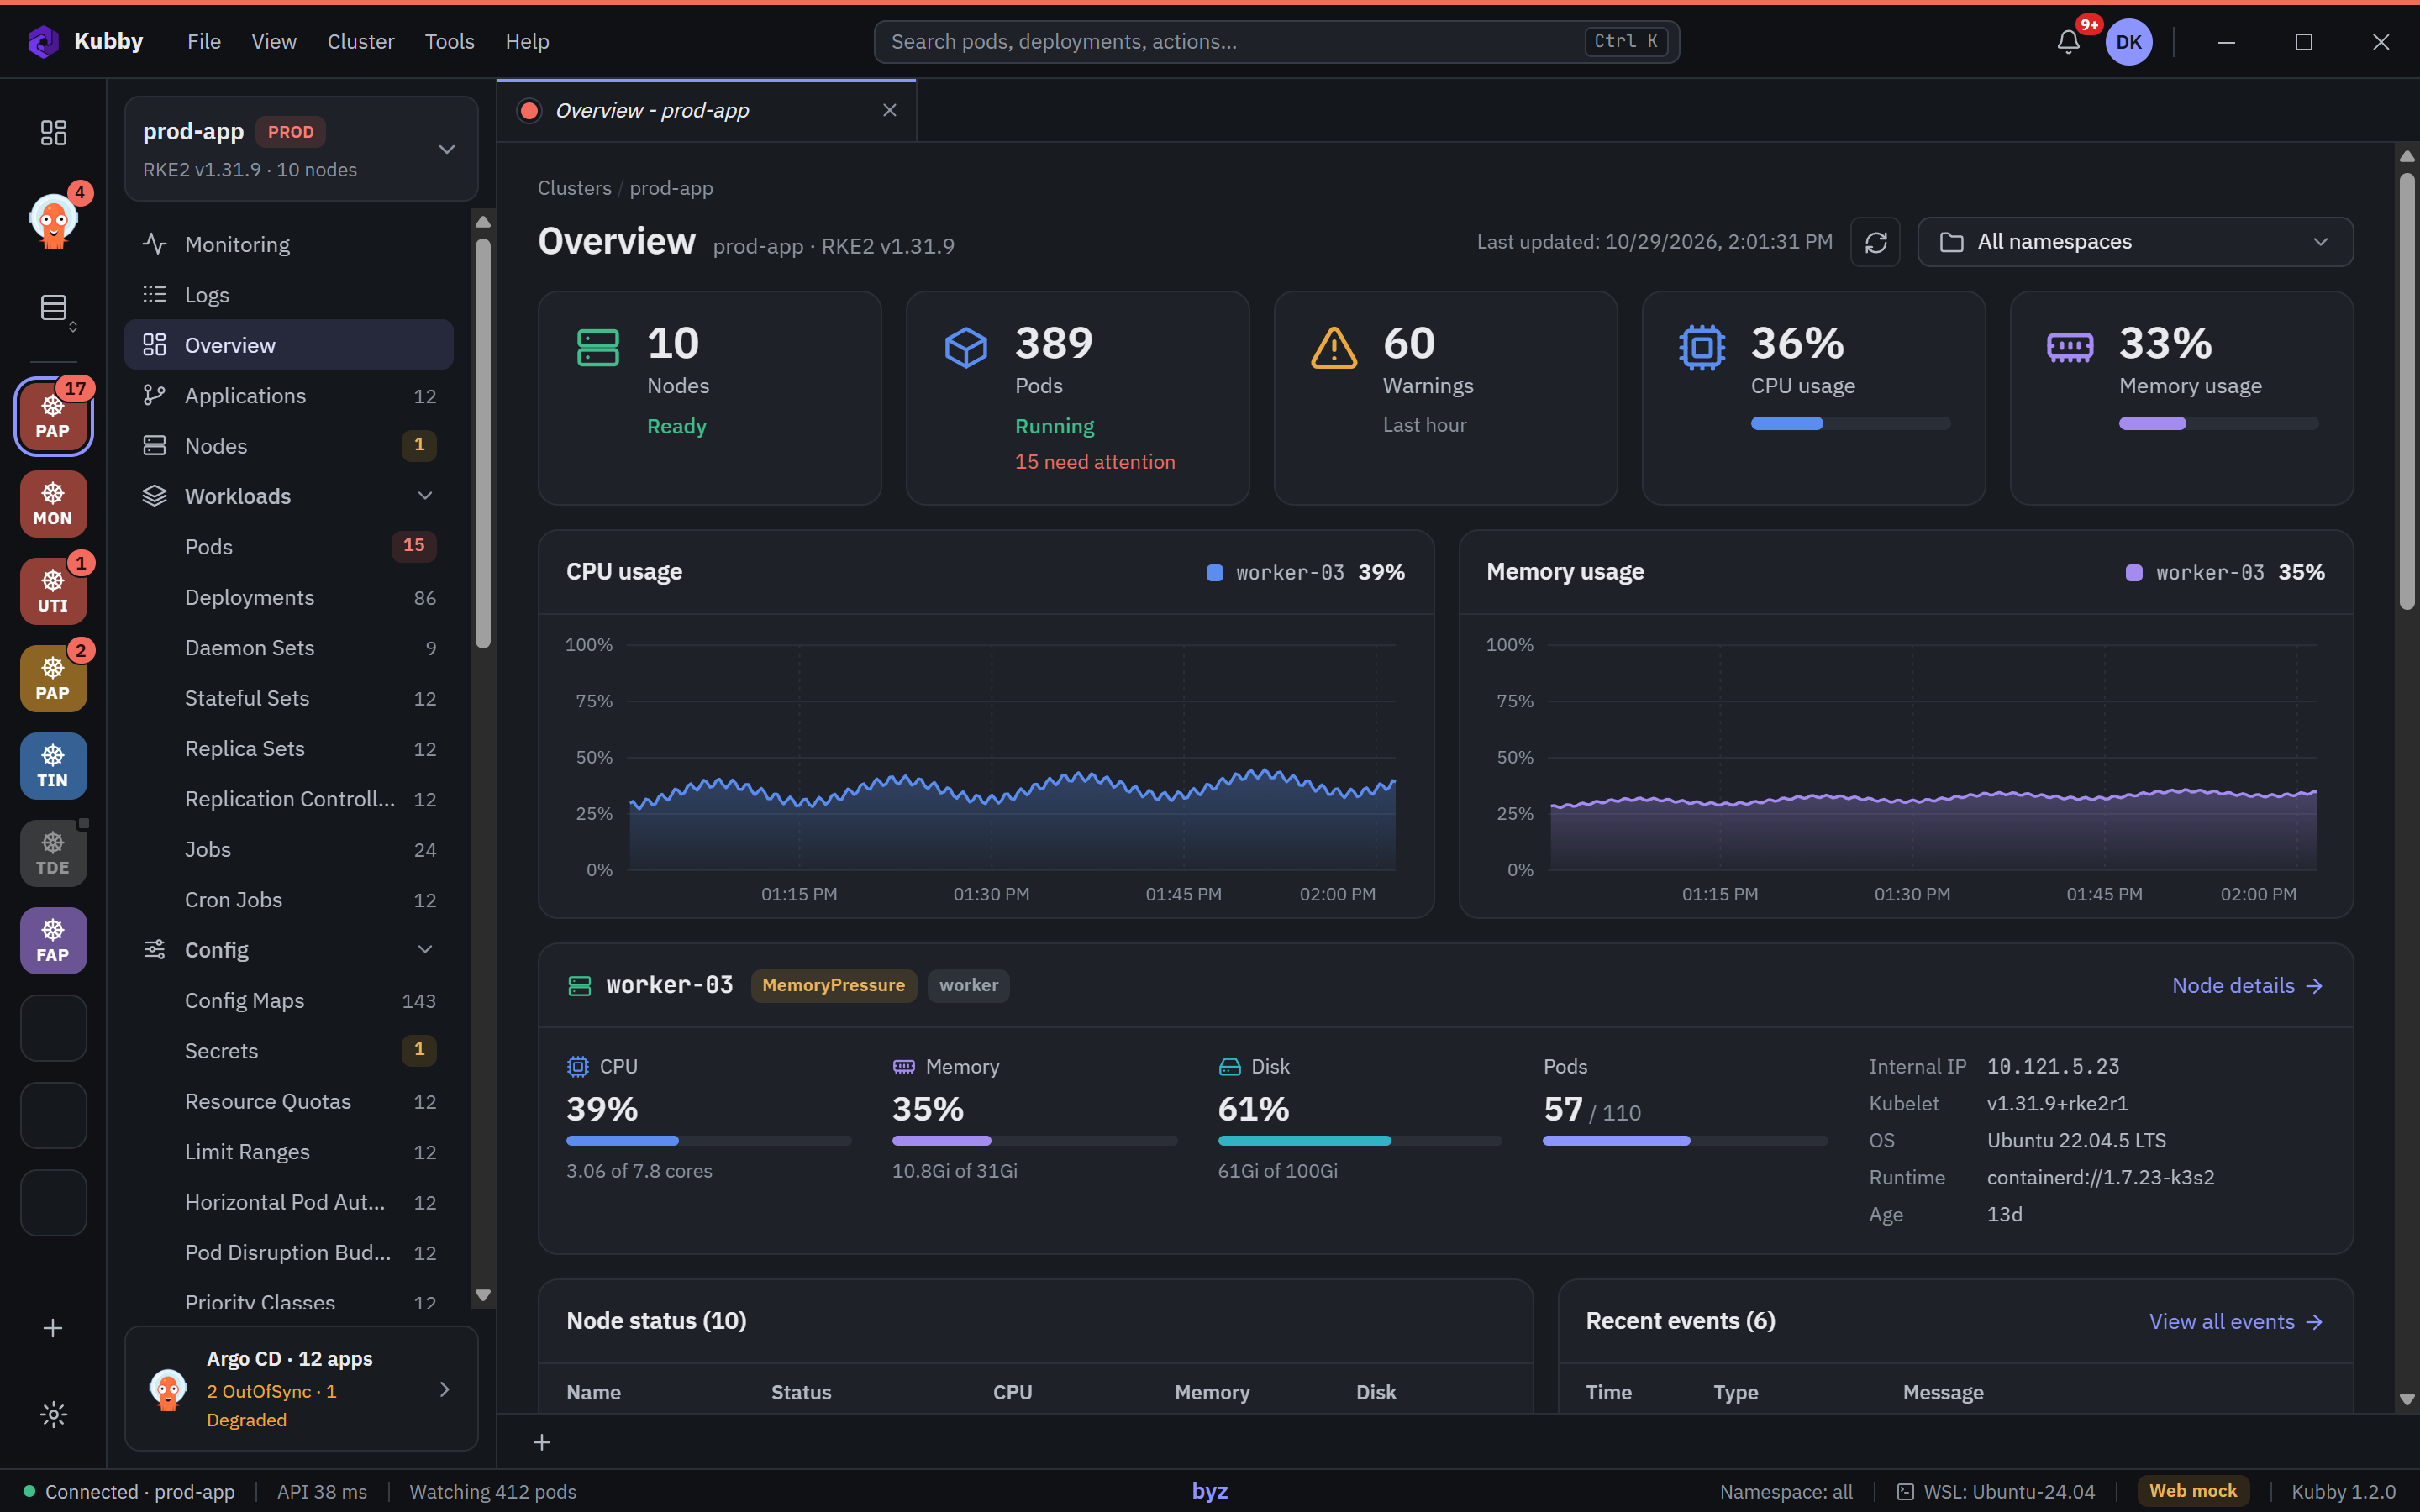
The Kubby window has five parts: the cluster bar, the navigator, the workspace, the bottom dock and the status bar.
Cluster bar
The narrow column on the far left holds your clusters, the Argo CD centre and the Clusters page. The red number on a tile is the number of problems in that cluster.
Navigator
The menu of the open cluster: Monitoring, Overview, Applications, Nodes and the resource groups (Workloads, Config, Network, Storage, Helm, Access Control, Custom Resources). Numbers are resource counts; coloured numbers are problems. The Argo CD summary sits at the bottom.
Workspace and tabs
Pages you open stay as tabs at the top; switch between them or close them. Clicking a resource opens its details in a panel on the right. Close the panel with Esc or by clicking an empty spot.
Bottom dock
The terminal and resource creation open in the bottom dock; Ask Kubby opens in its own panel on the right. The dock can be resized and maximised and holds several tabs. Open the terminal with Ctrl+`.
Top bar
Menus (File, View, Cluster, Tools, Help), search everywhere (Ctrl+K), the notification bell and your profile menu. The profile menu leads to Notes and signing out.
Status bar
At the bottom: connection state, API latency, the number of watched pods, the selected namespace and the Kubby version.
Theme
Kubby has a dark and a light theme and follows the Windows setting by default. Change it from the View menu or Preferences → App.