Monitoring
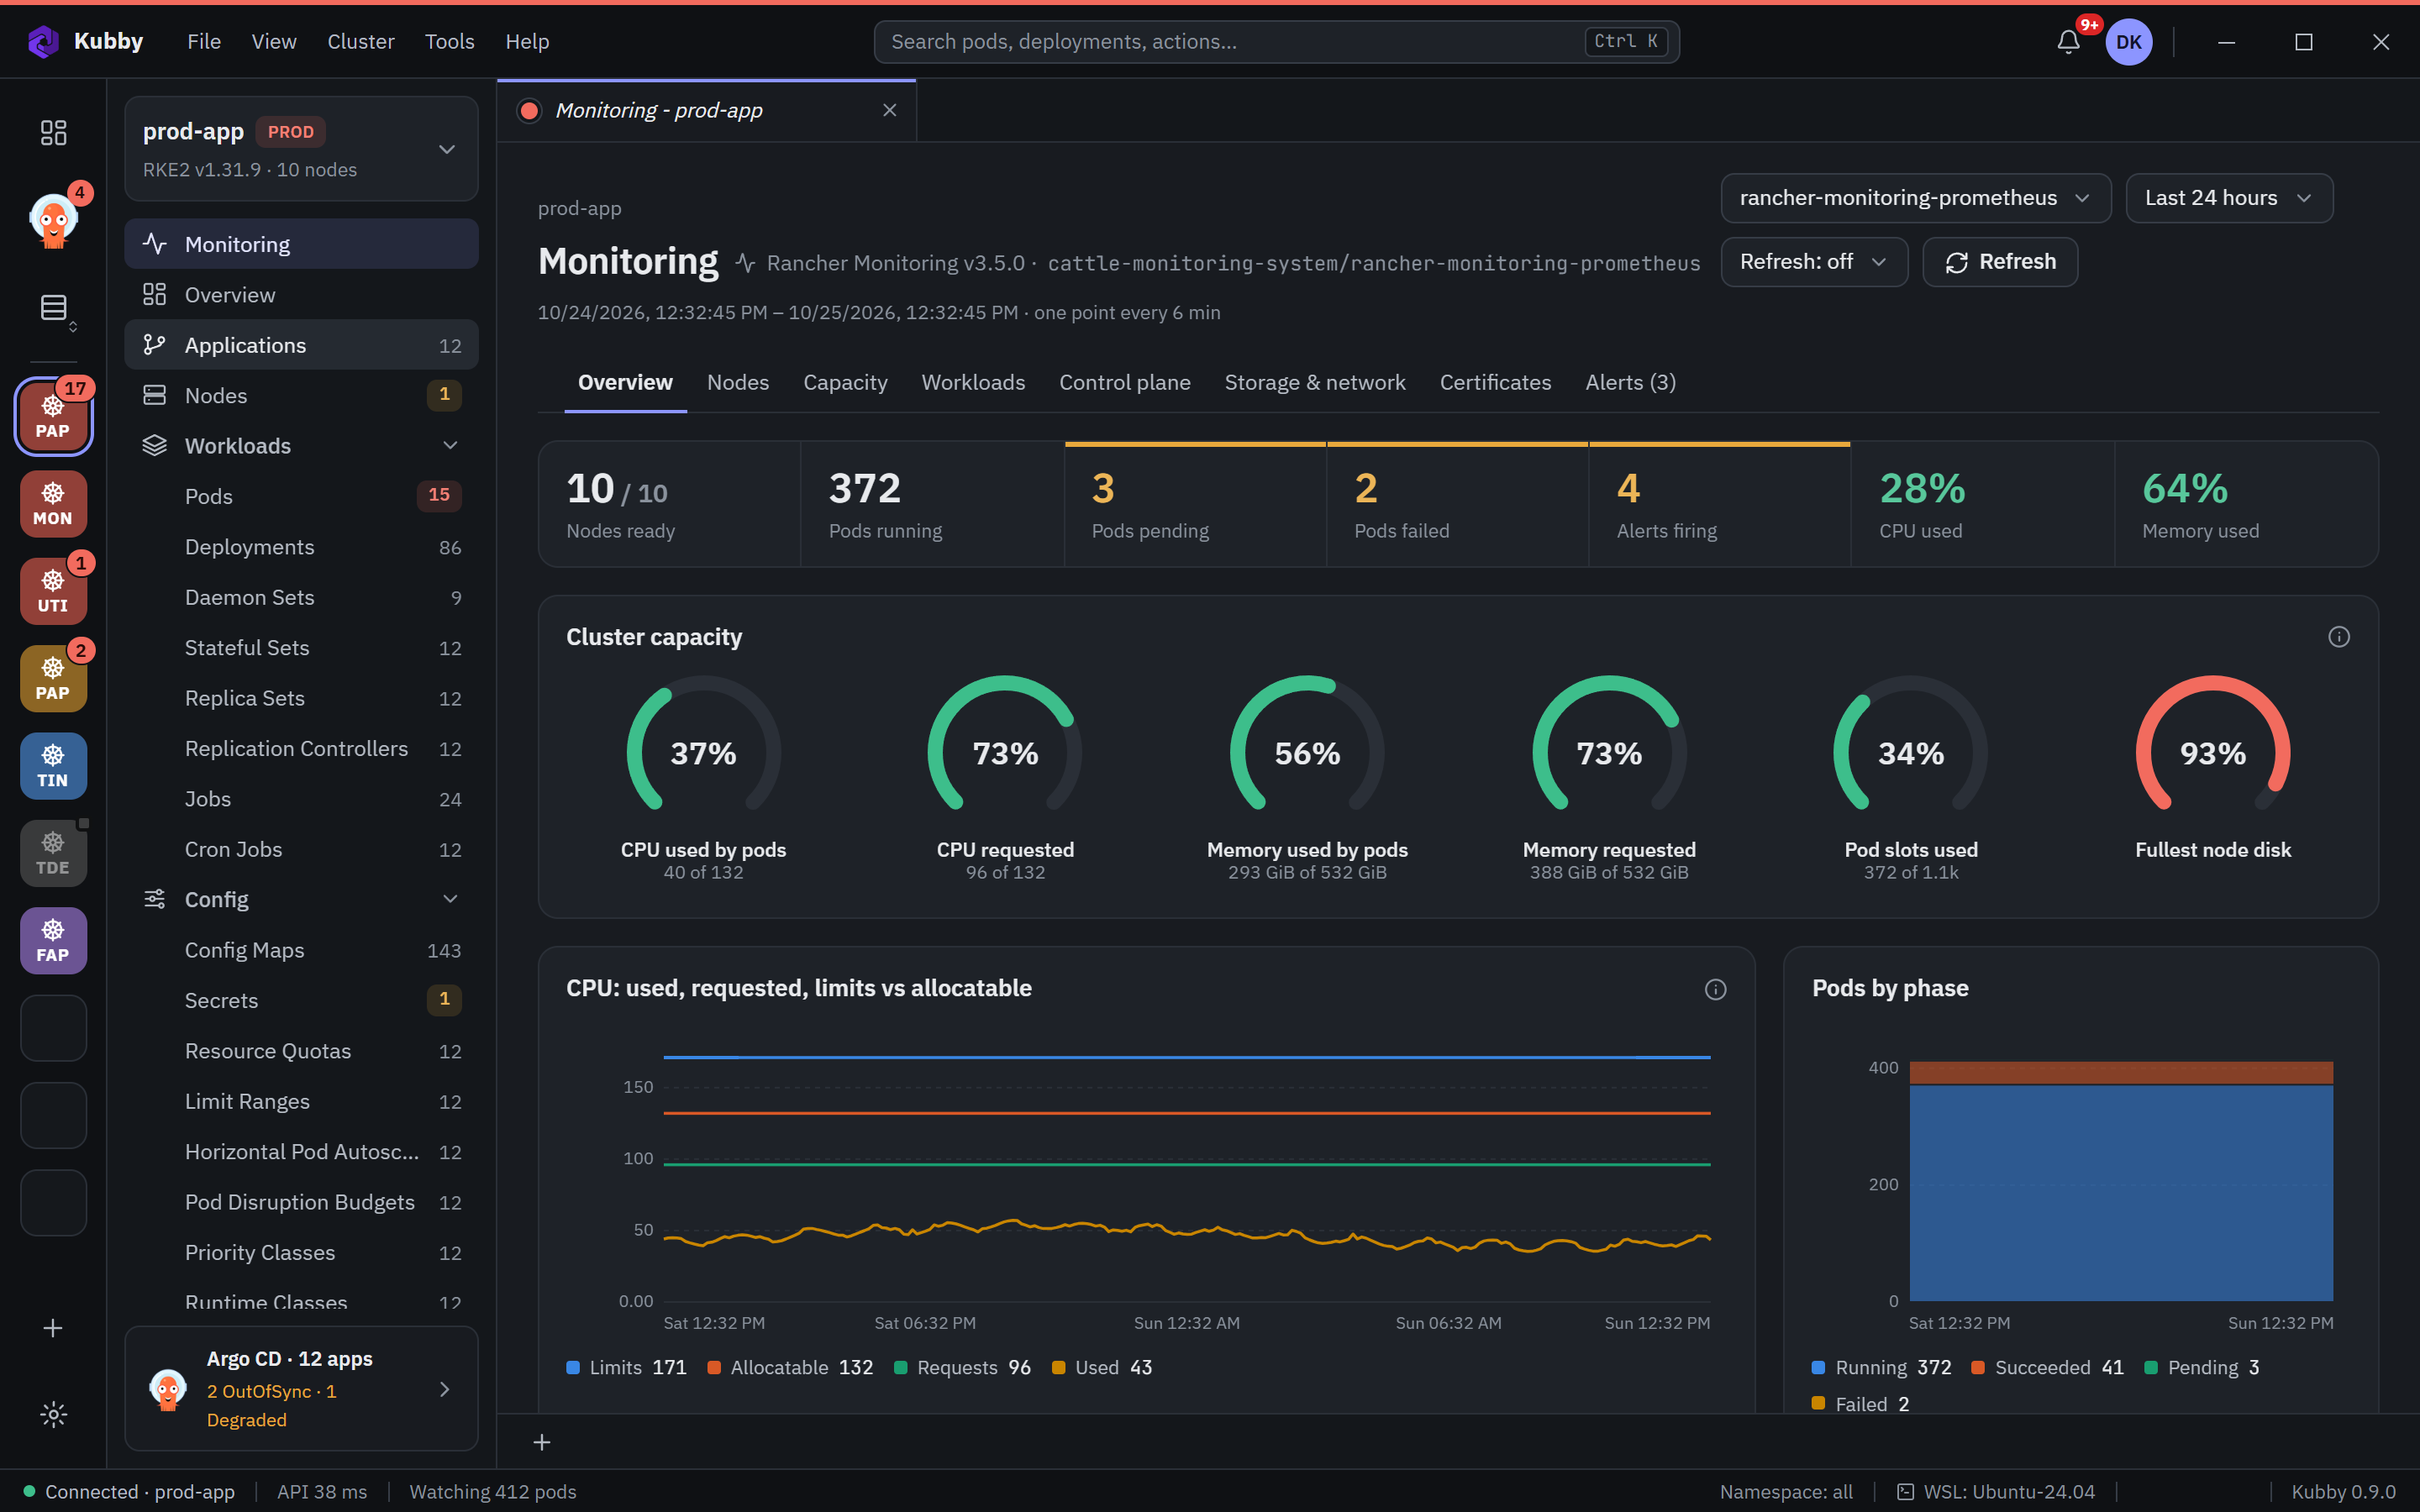
Monitoring gives you ready-made dashboards from the open cluster's own Prometheus: node health, capacity, workloads, control plane, storage, network, certificates and alerts.
Connecting to Prometheus
Kubby finds the Prometheus service in the cluster by itself and reaches it through the Kubernetes API service proxy. No port forward, ingress or extra token is needed; your existing permissions are enough. Supported setups:
- Rancher Monitoring,
- kube-prometheus-stack,
- the prometheus Helm chart.
If the cluster runs more than one Prometheus, pick one at the top right; the choice is remembered per cluster.
get on services/proxy for the Prometheus service, Kubby says so and what to ask for.Time range and refresh
Choose ranges from 5 minutes to 24 hours. Refresh fetches the data again at once; auto-refresh can be 30 seconds, 1 or 5 minutes.
Tabs
| Overview | Ready nodes, pod states, alerts; cluster capacity rings; CPU and memory: used, requested, limits, allocatable. |
|---|---|
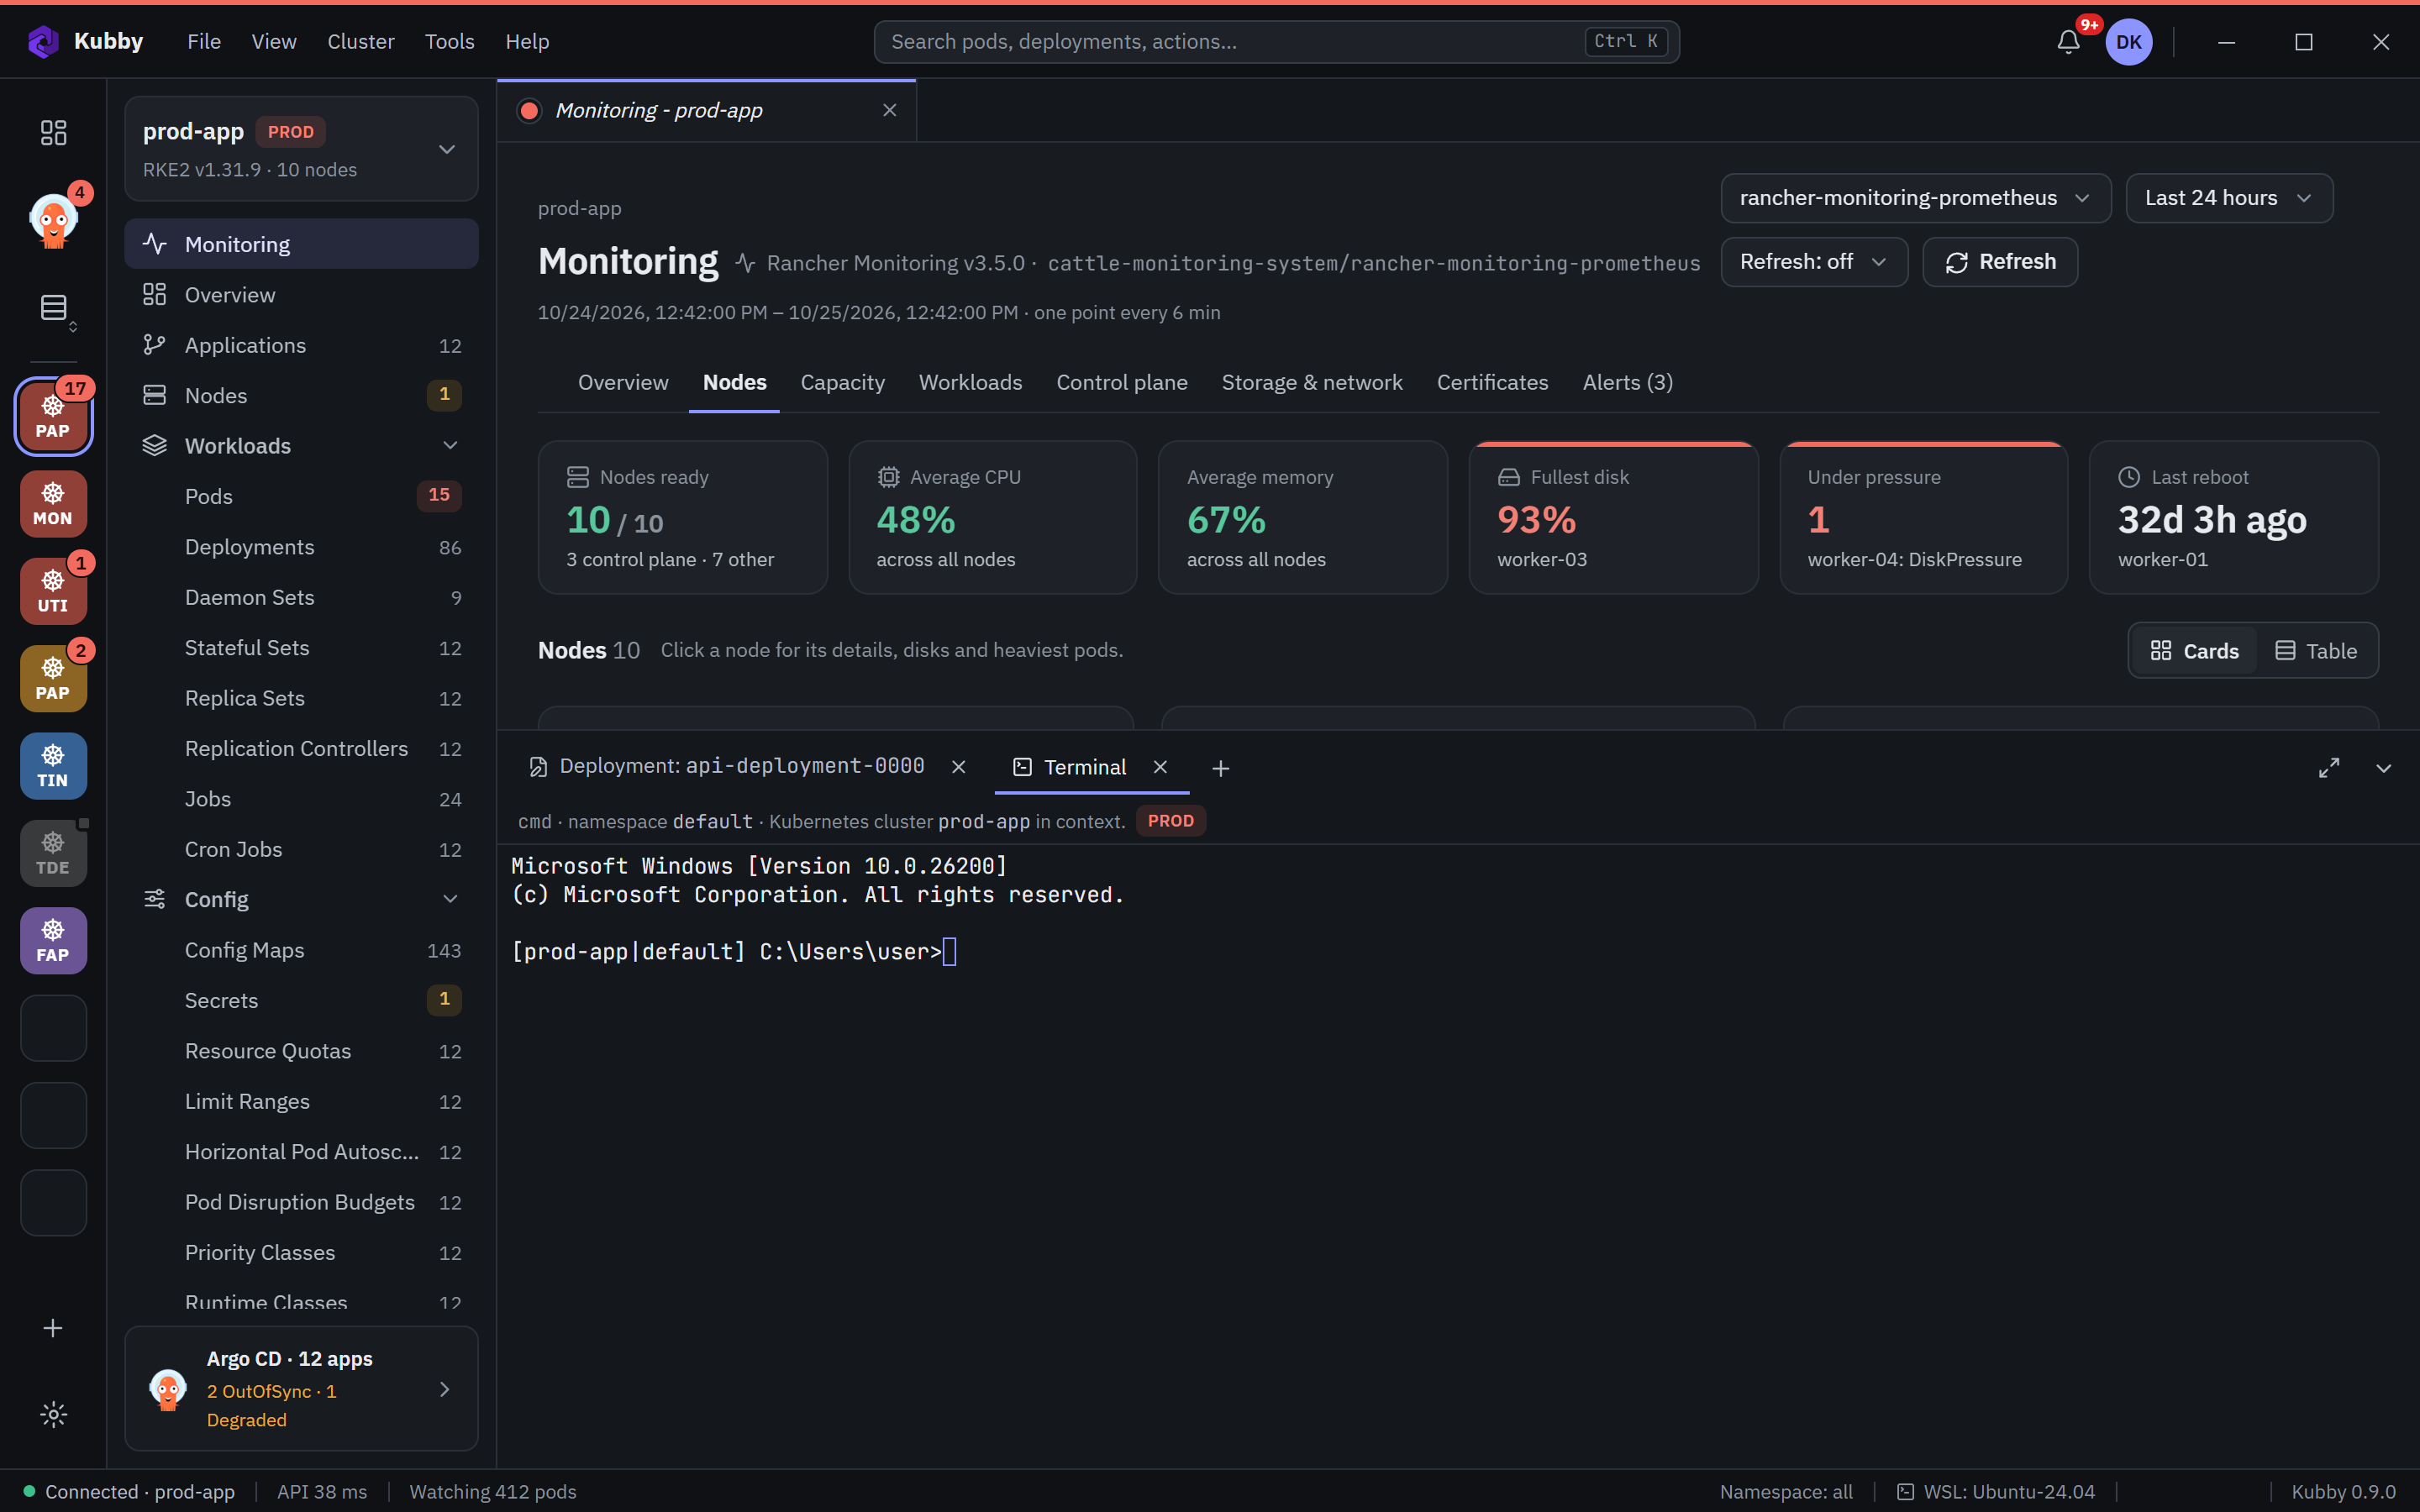
| Nodes | A card per node: IP, CPU, memory, CPU / memory / disk rings, uptime, load, pod count, OS and kernel. Click for its disks (as rings), heaviest pods and charts below. Optional table view with adjustable columns. |
| Capacity | Requests now and if the biggest node fails; requests and limits per node (overcommit); requested but unused resources; containers without memory limits. |
| Workloads | Top CPU and memory pods, restarts, OOMKilled, throttling, waiting containers, HPAs at maximum, failed CronJobs. |
| Control plane | API server requests, error rate and latency; etcd leader, fsync time and database size; scheduler; CoreDNS; admission webhook latency. |
| Storage & network | PVC usage and fill forecast, node disk fill forecast, network traffic and errors, ingress requests and 5xx rate. |
| Certificates | Days left on kubelet client and serving certificates, cert-manager certificates, API requests made with client certificates about to expire. See certificate expiry. |
| Alerts | Firing and pending Prometheus alerts with severity; firing alerts also appear in the notification bell. |
Drilling down
Click a namespace or a pod in a bar list: that namespace's pod charts, or the pod's container CPU, memory (with the limit line), network and restart charts, open right below the panel.