
Problems first
Pods, Events and the Overview put CrashLoopBackOff, OOMKilled and ImagePullBackOff at the top, not on page four of a table.
Counts on every resource kind and on every cluster in the rail tell you where to look.
Learn more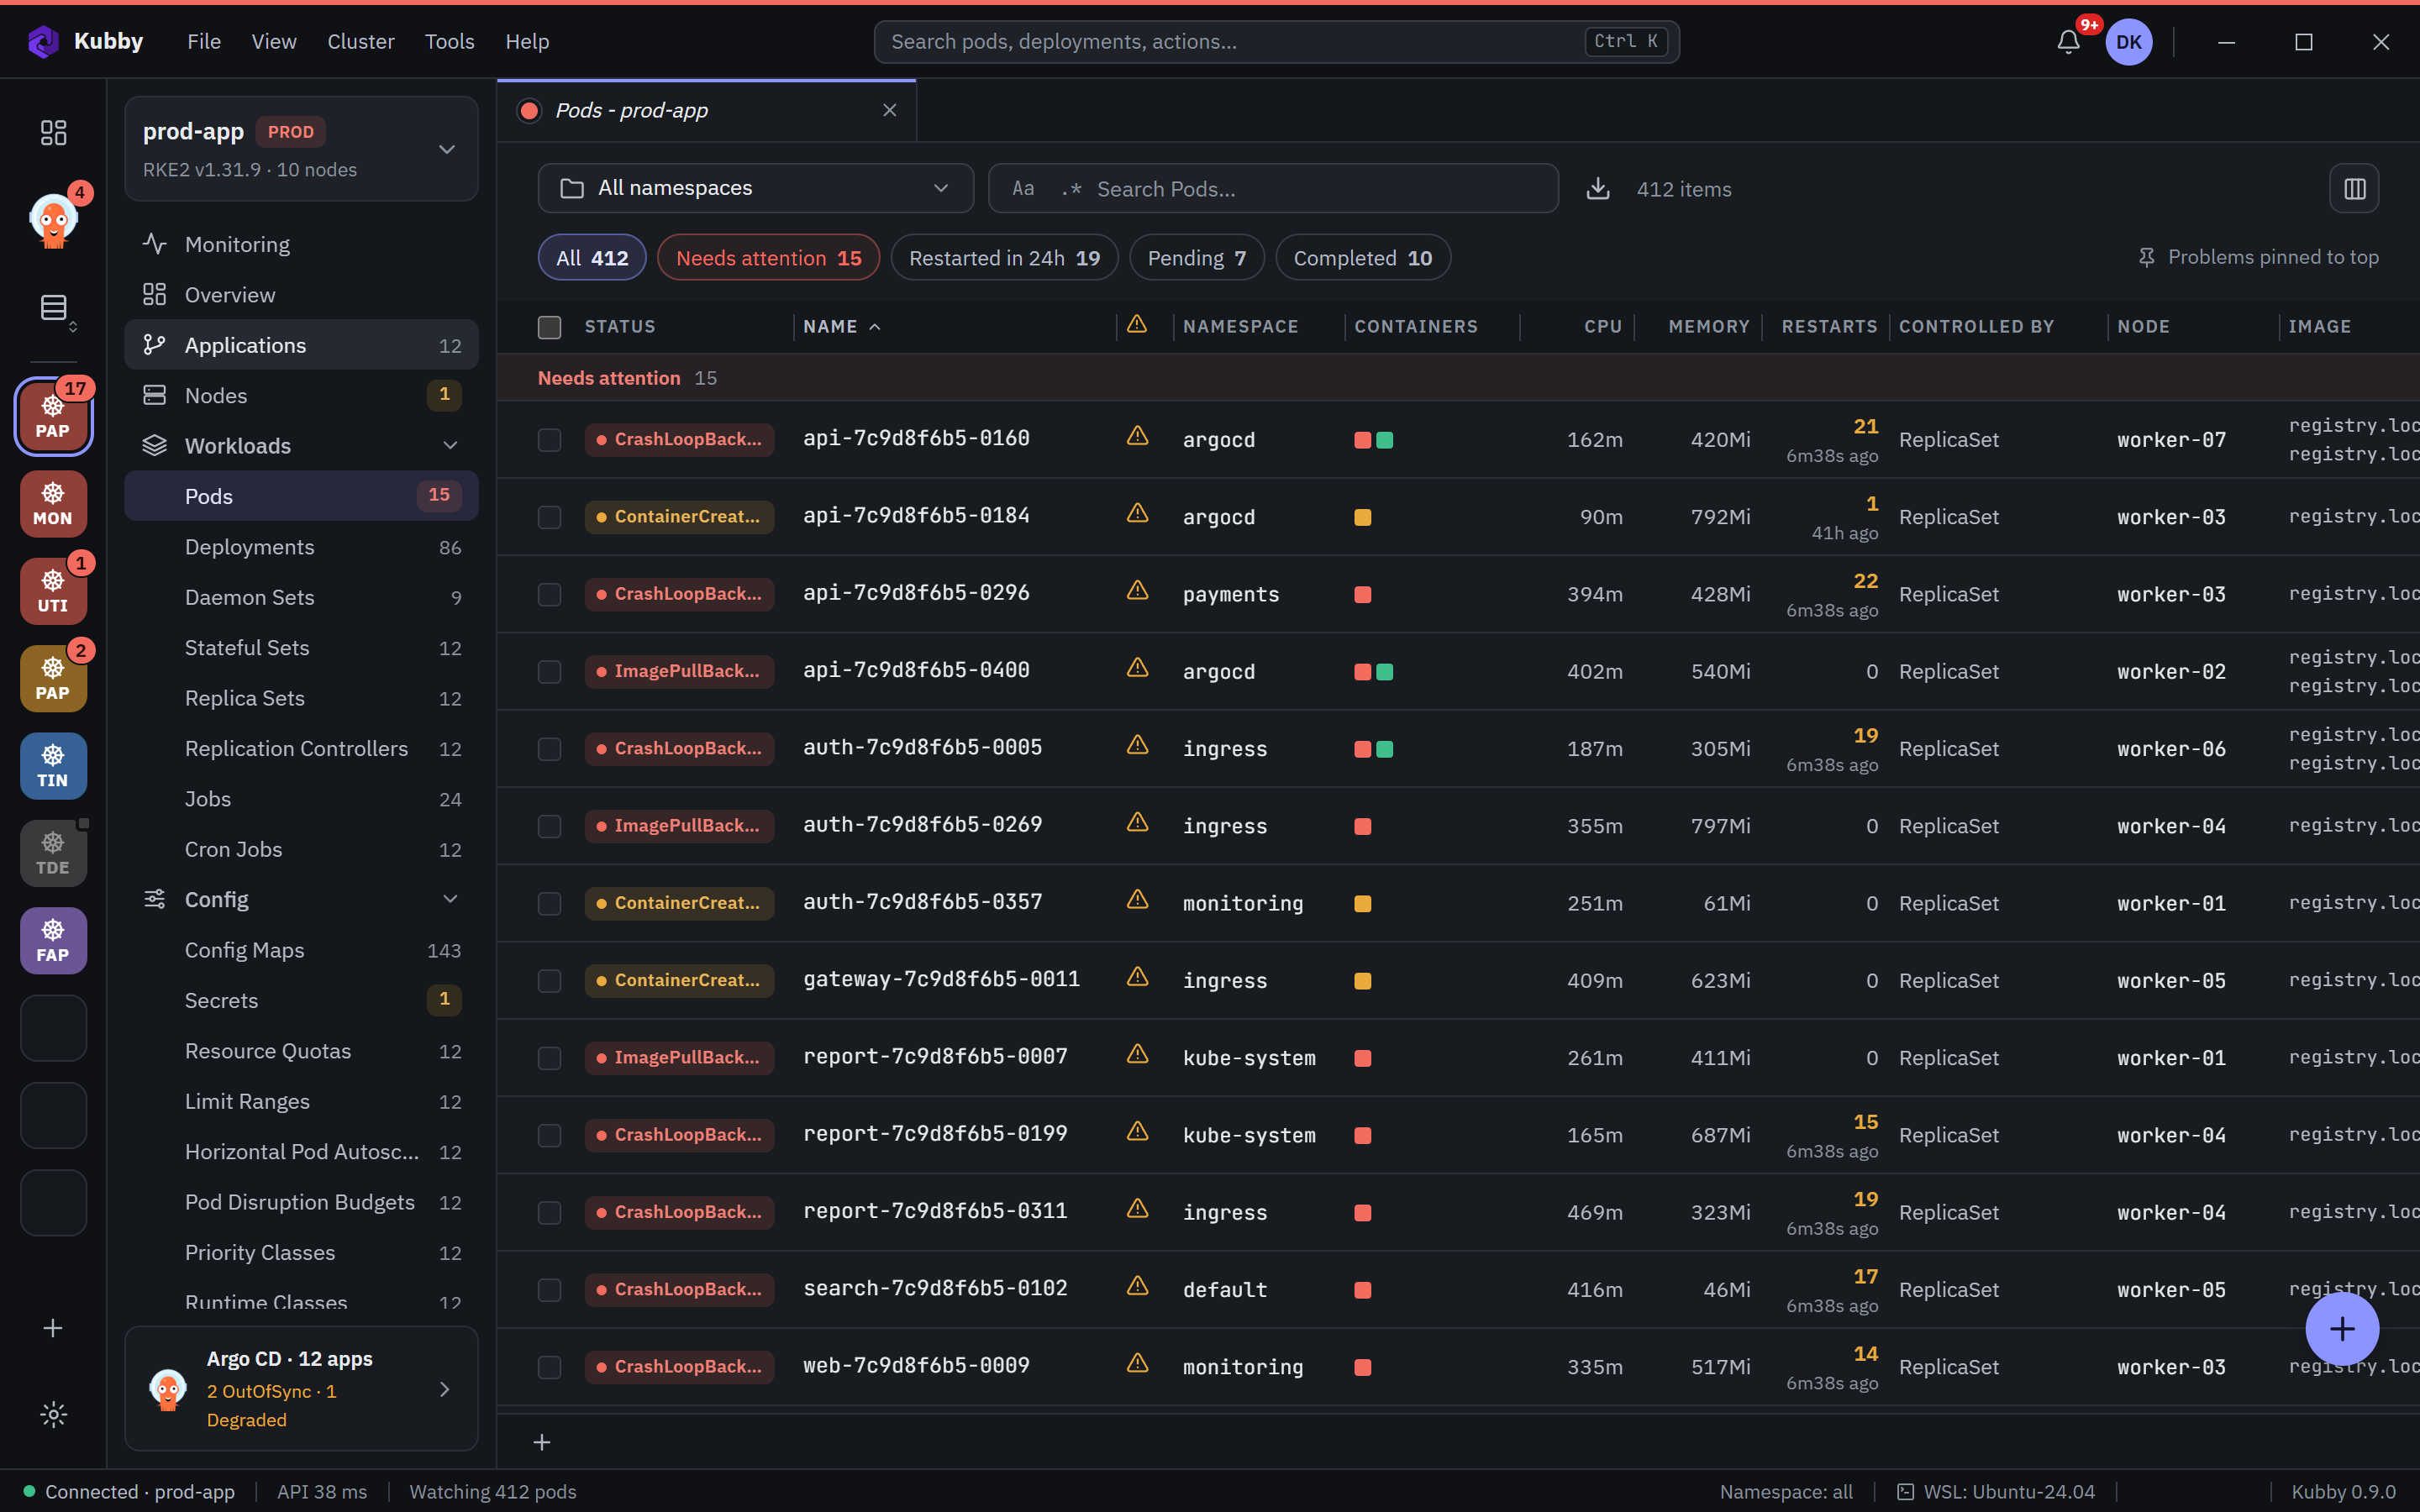
Real Kubby screens on test data. Every feature is free for everyone.
Pods, Events and the Overview put CrashLoopBackOff, OOMKilled and ImagePullBackOff at the top, not on page four of a table.
Counts on every resource kind and on every cluster in the rail tell you where to look.
Learn moreReady nodes, running pods, warnings of the last hour and the CPU and memory of the whole cluster at the top of the Overview.
Pick a node to see its CPU and memory over the last hour, its disk, pods and versions. The node table shows CPU, memory and disk for all of them, and which one is under pressure.
Learn more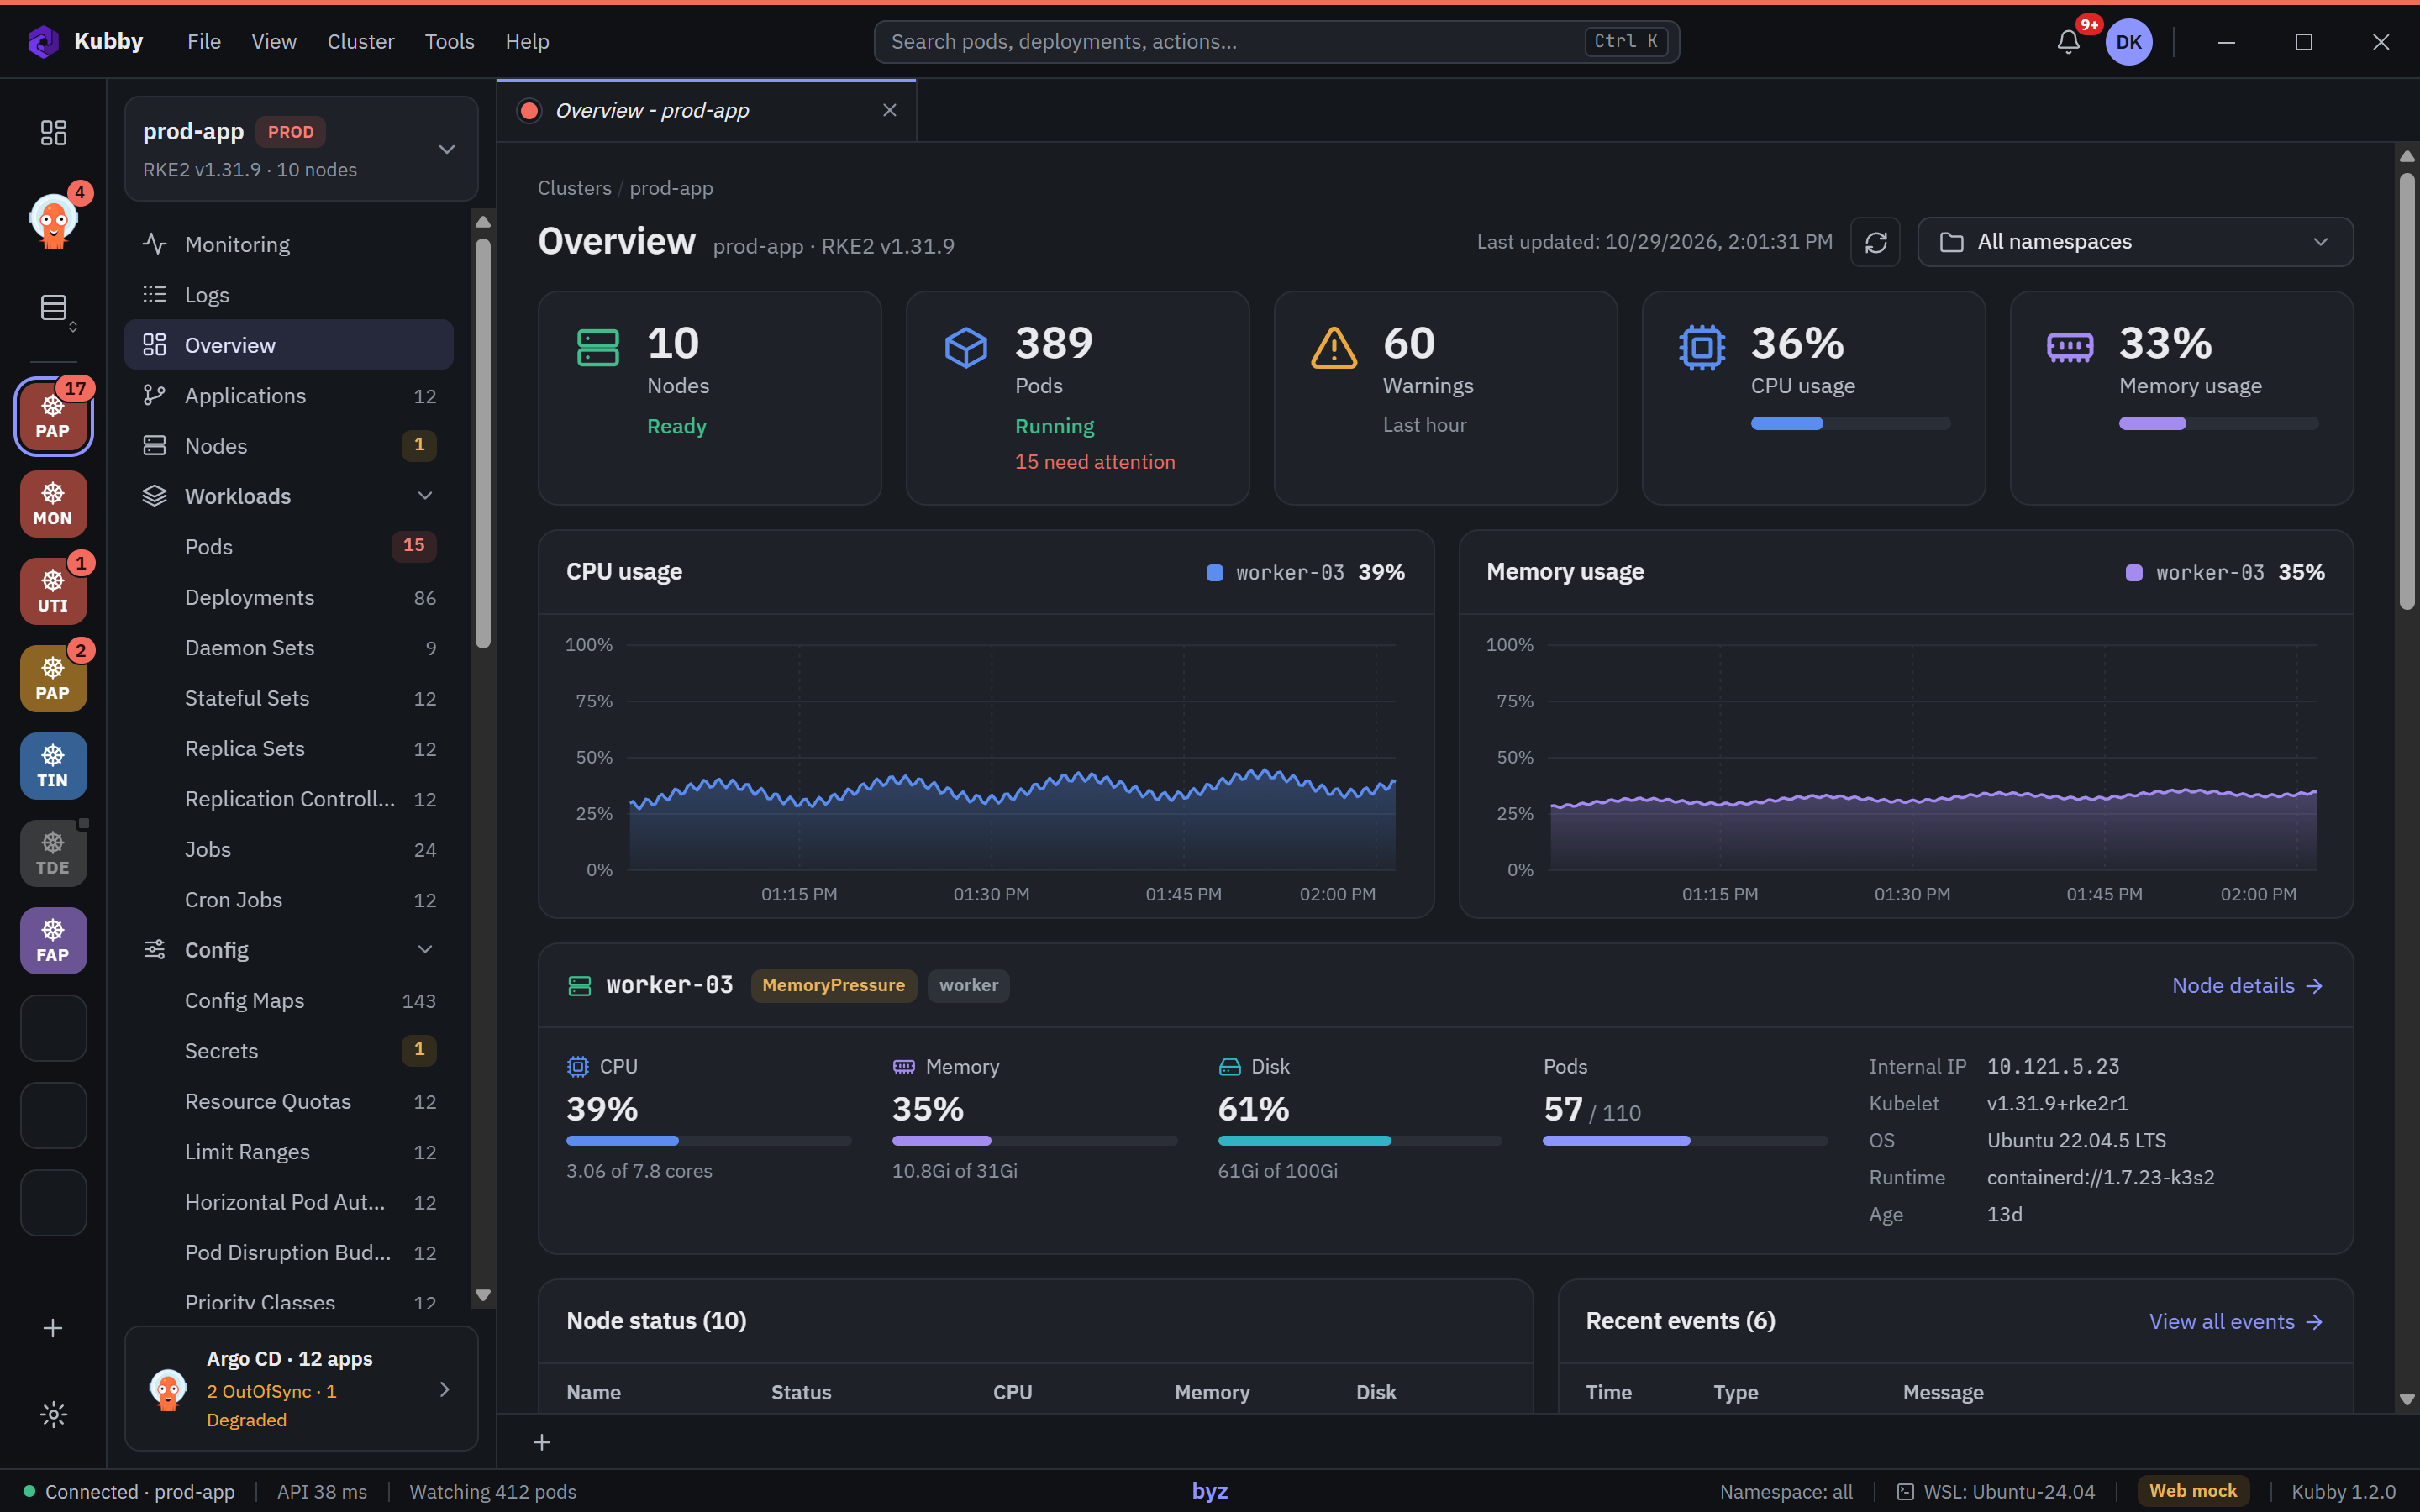
A grade from A to F and a score out of 100 for workloads, pods, nodes, network, storage and security, with a 30-day trend.
Fix first lists what costs the most points: no memory limit, images without a fixed tag, containers running as root, services without endpoints. Accept the ones you keep on purpose, with a reason.
Learn more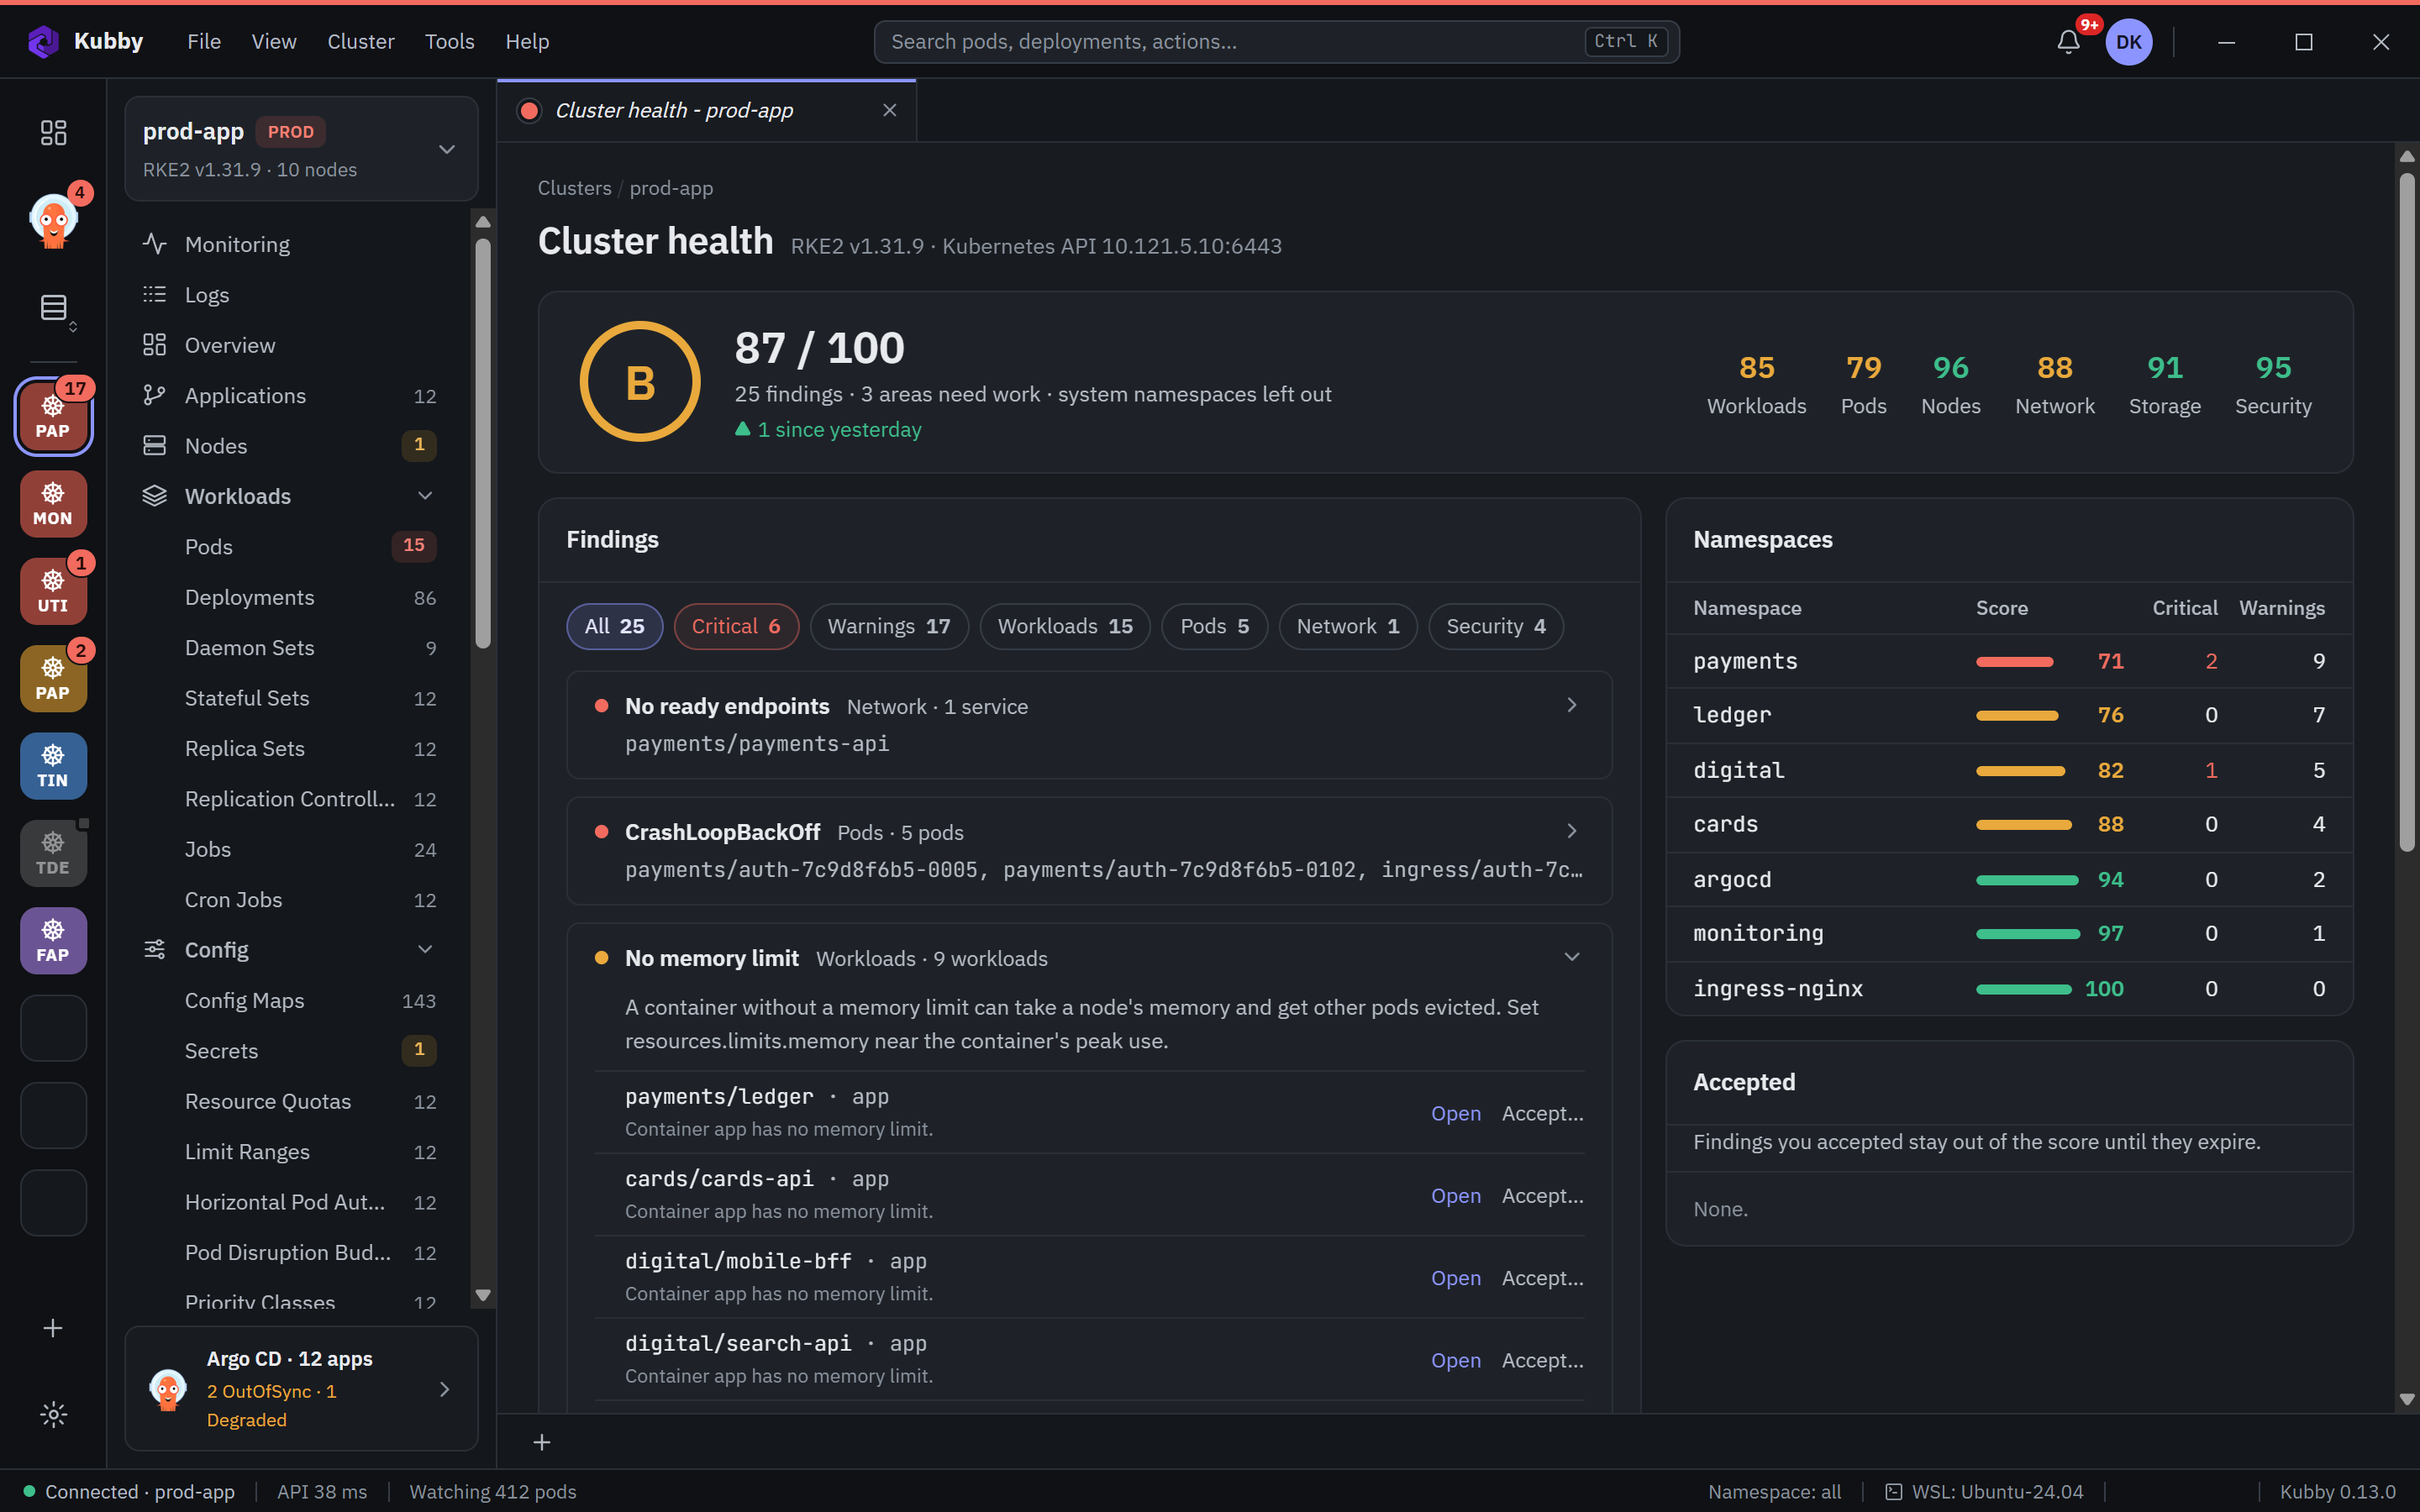
Kubby answers in one sentence: exit code, memory peak against the limit and the restart pattern.
The logs before the crash are one click away.
Learn more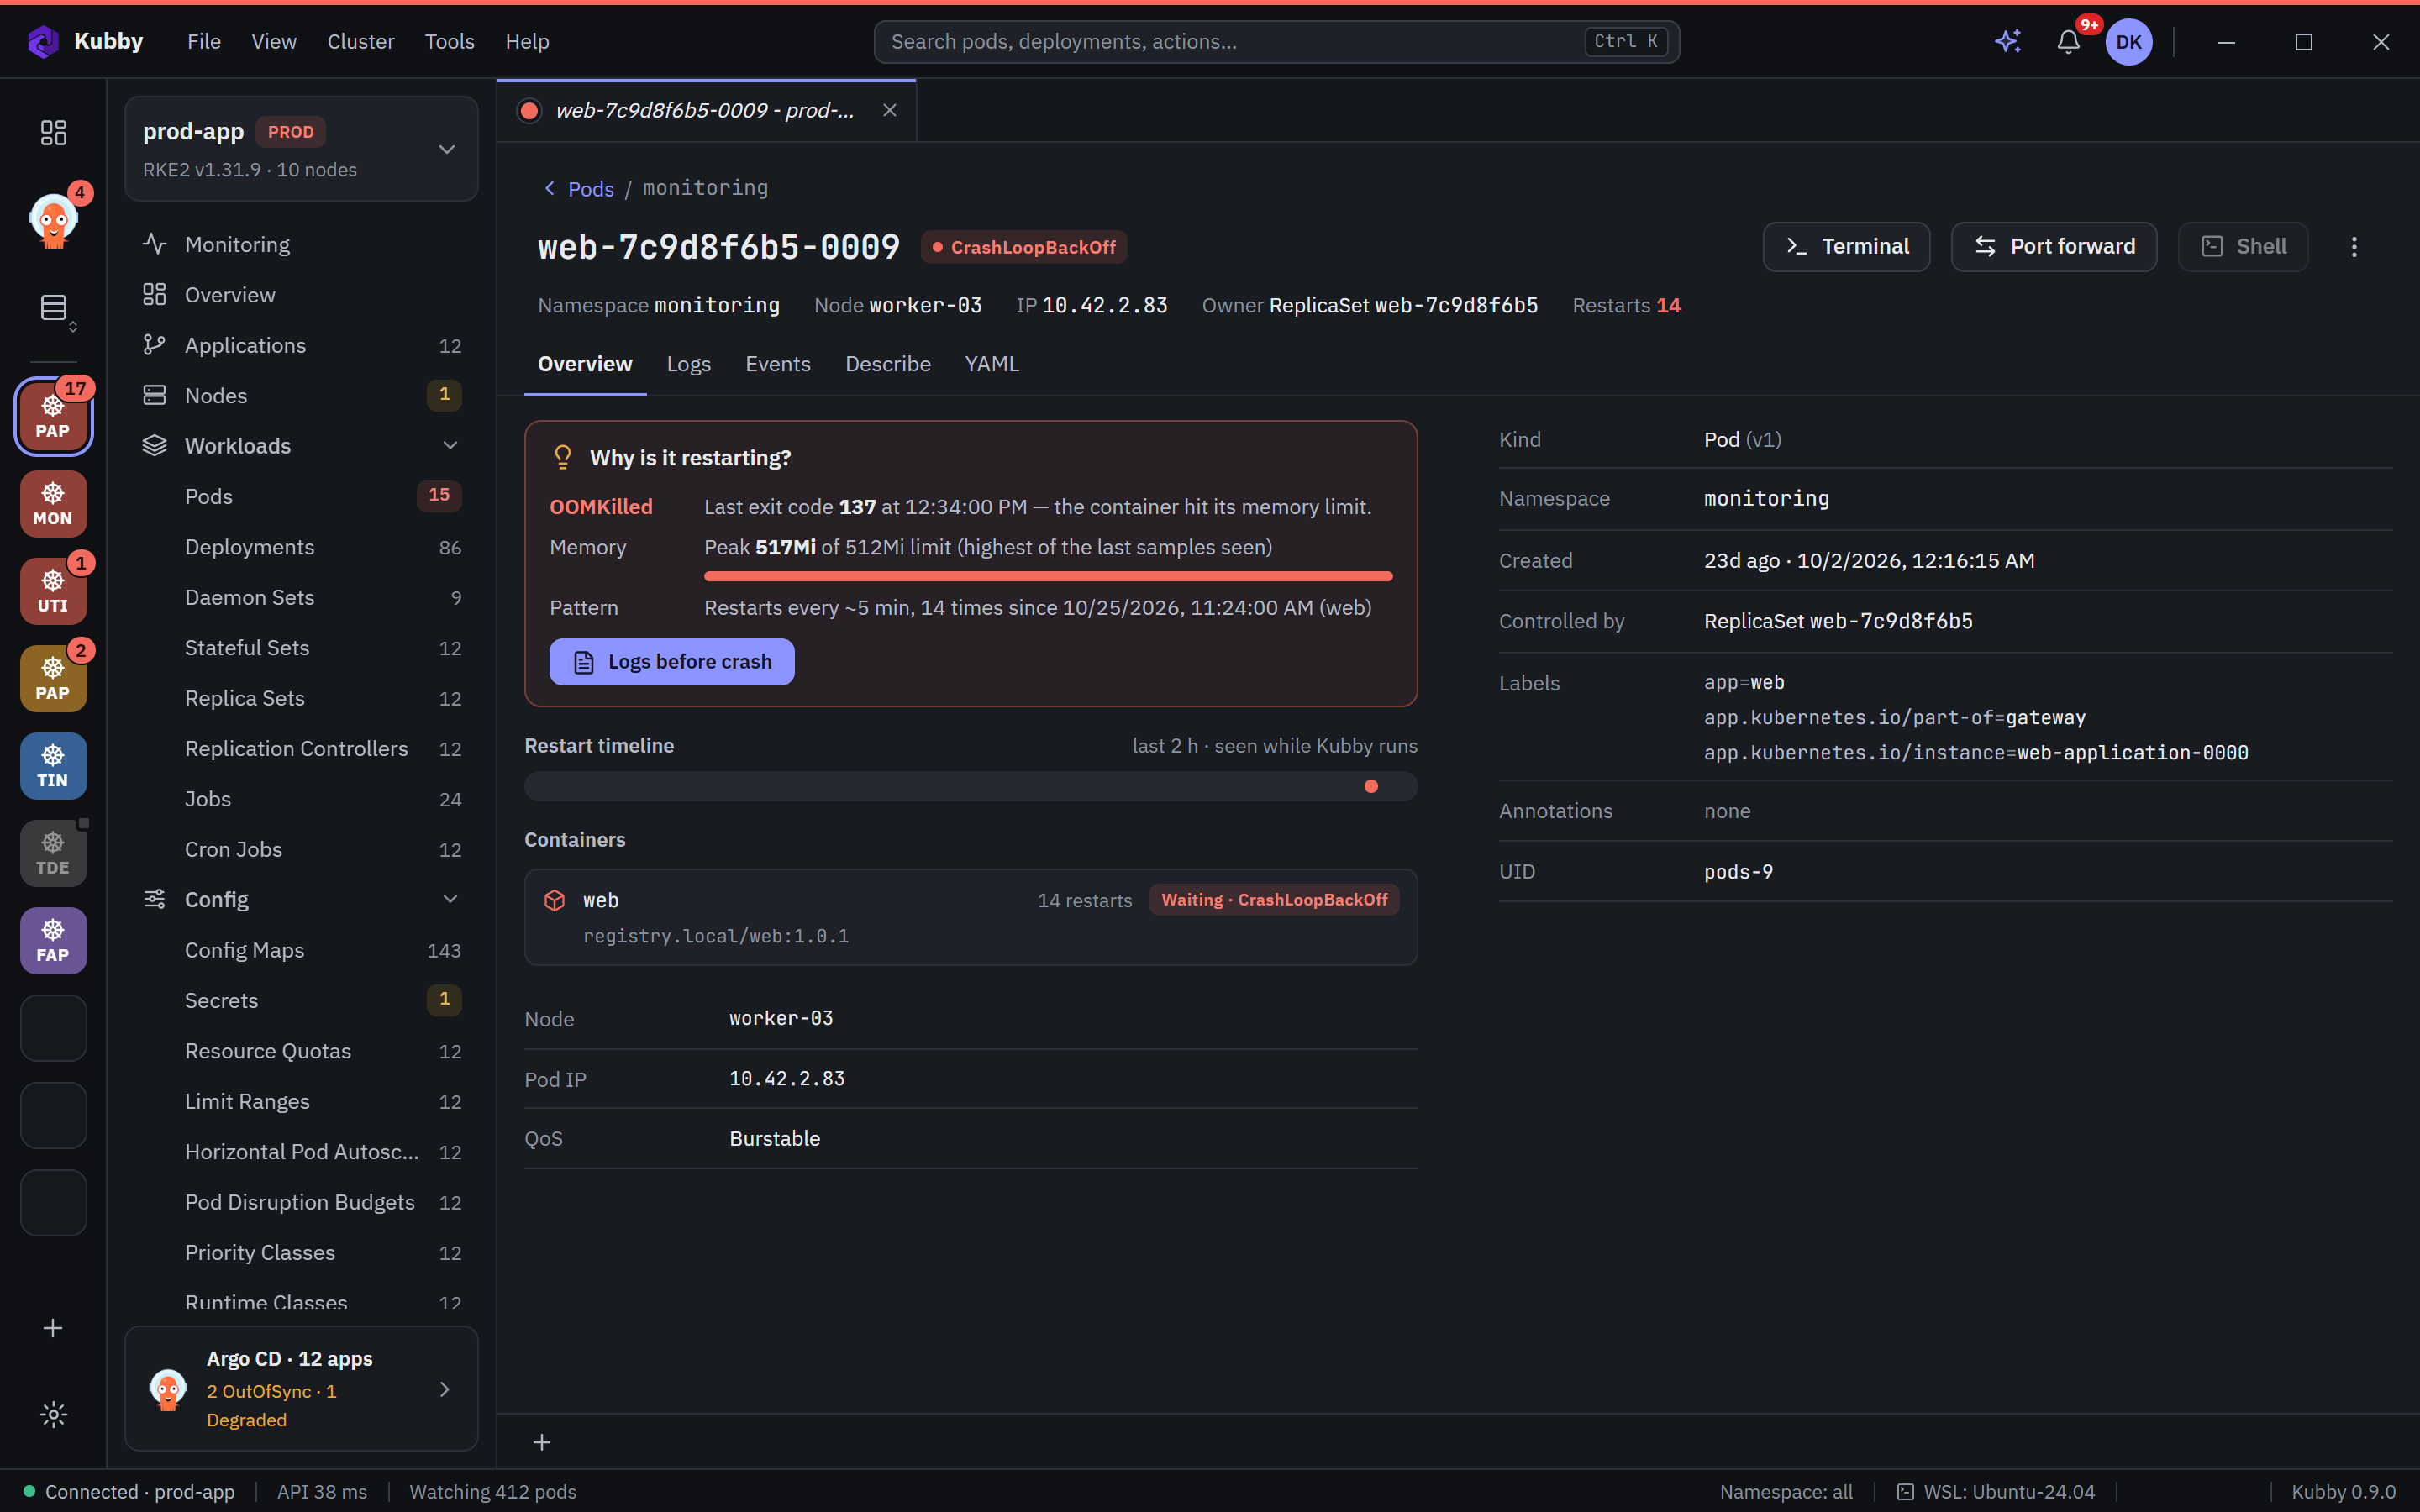
Connect Claude, ChatGPT, Gemini, Grok or your company's AI gateway with your own account. It reads the cluster through Kubby's read-only tools.
It explains the cause with the evidence and proposes a change for your review.
Learn more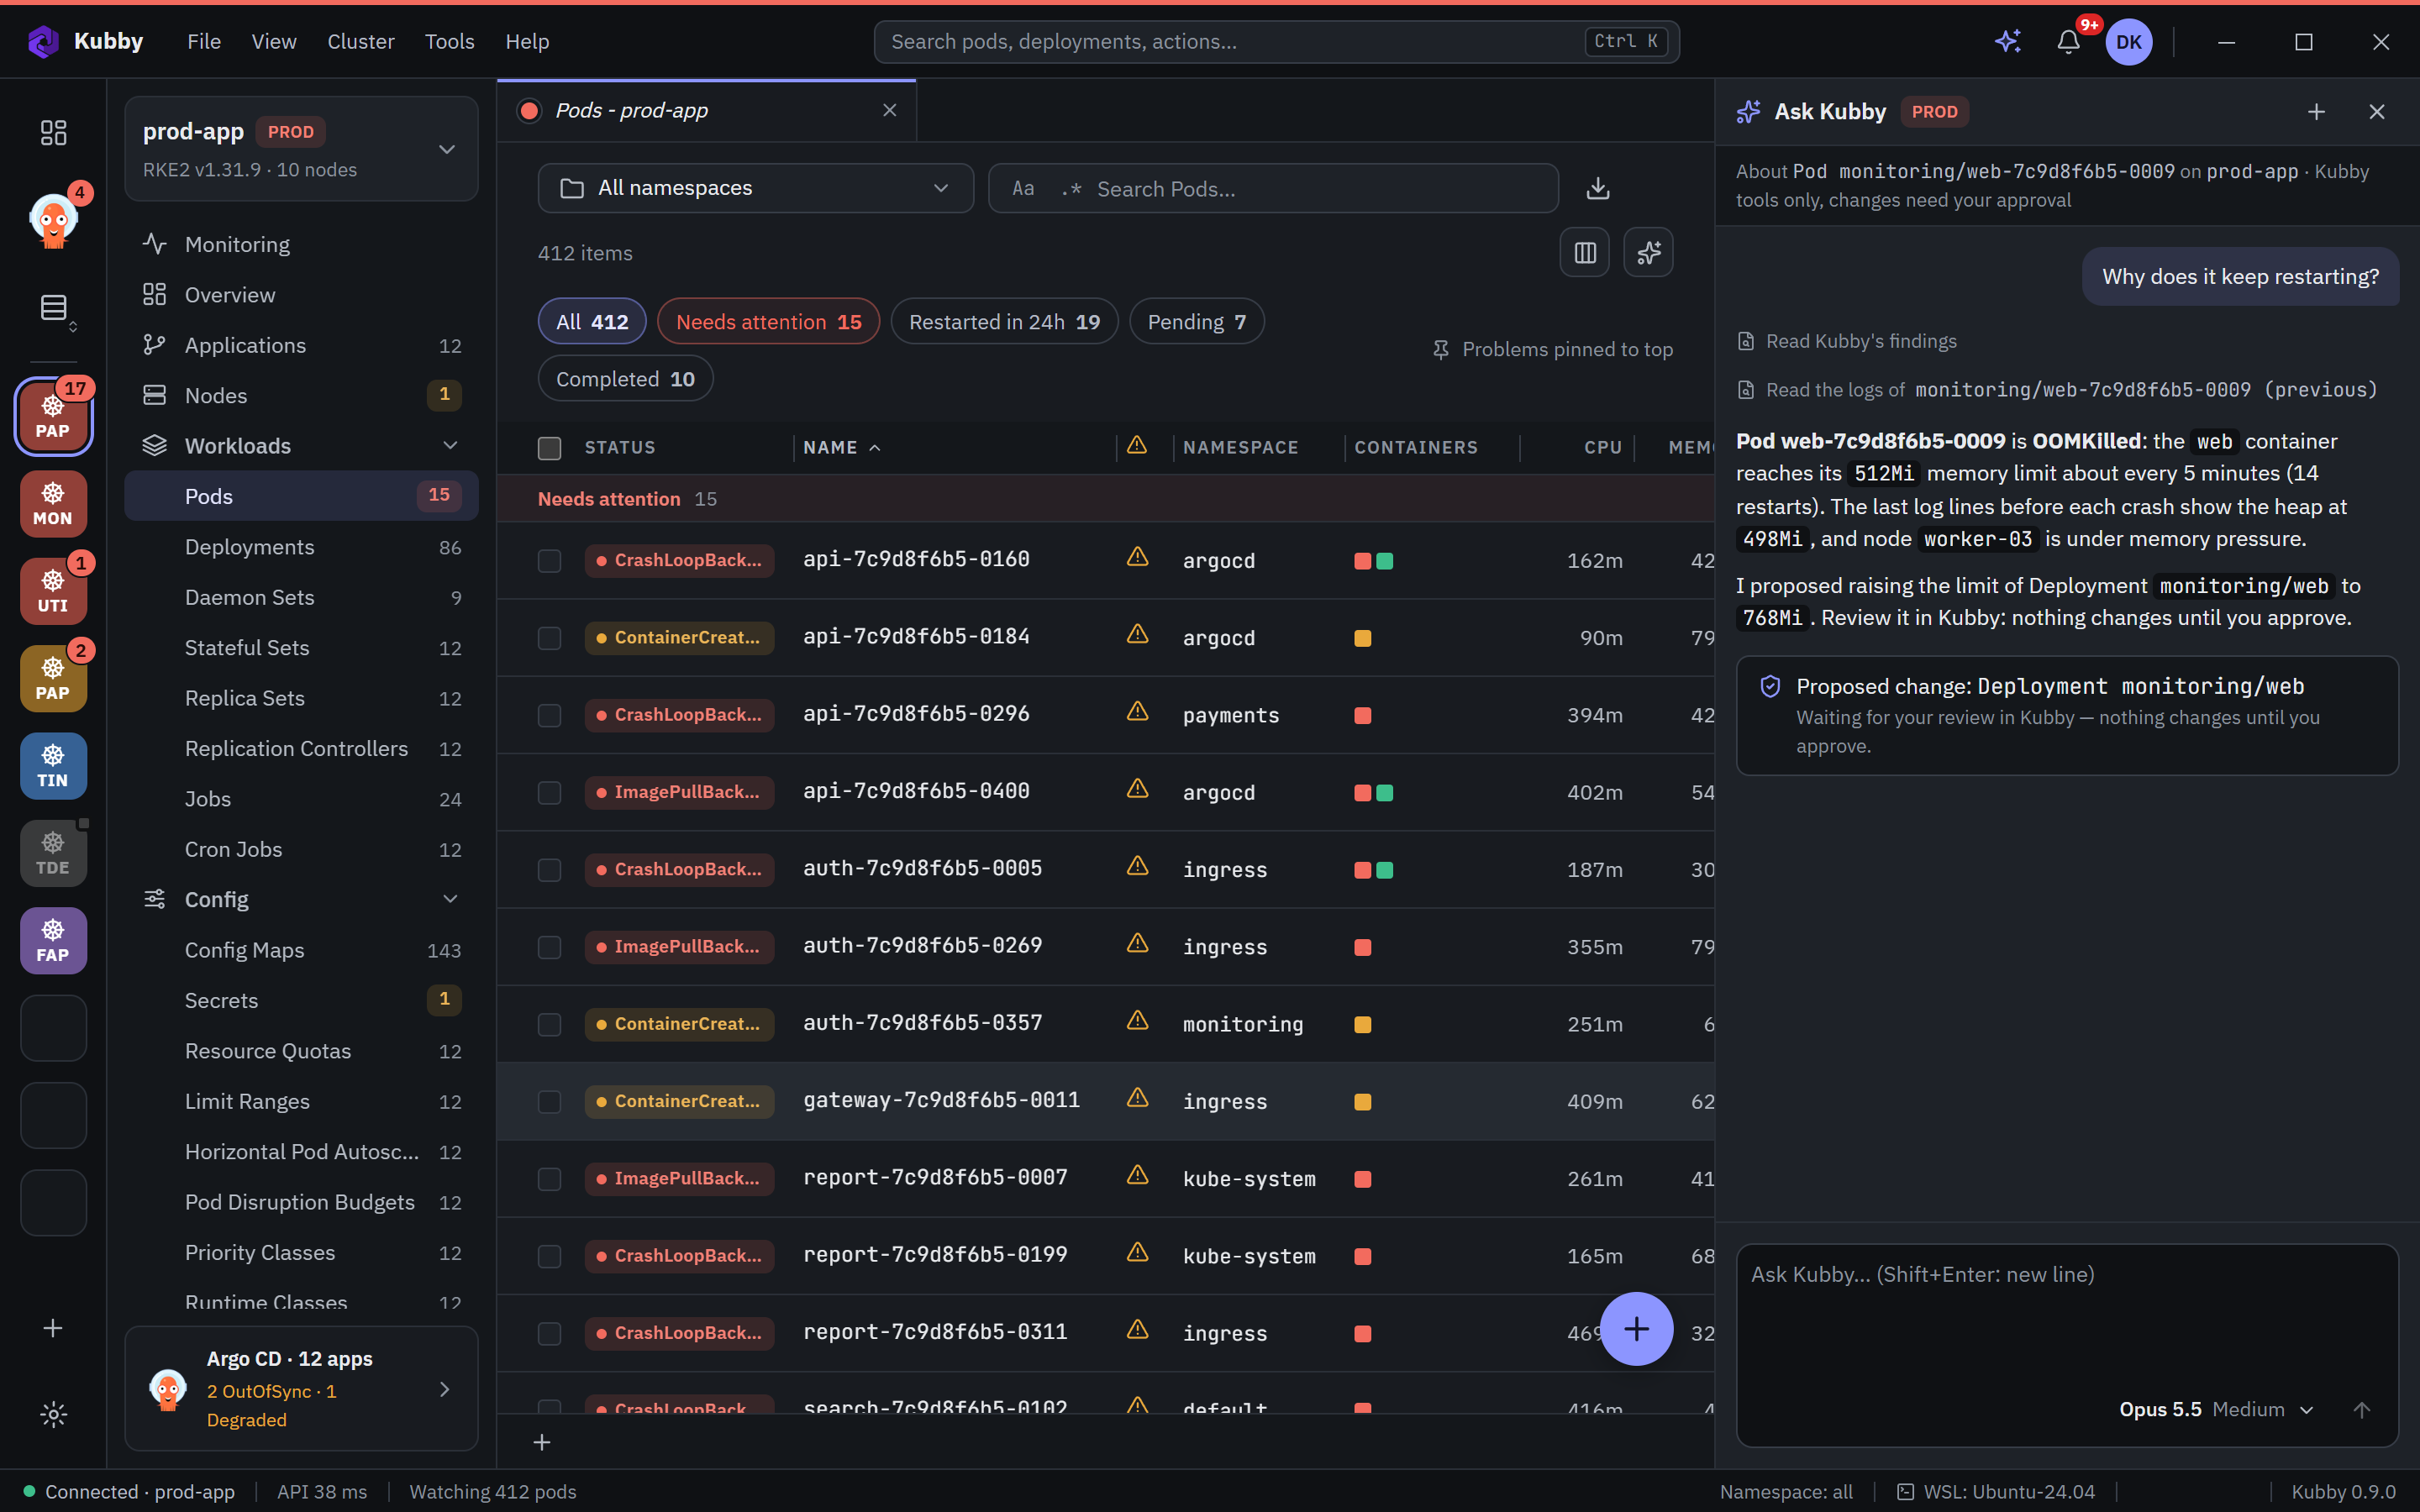
Every proposal and every YAML edit shows a diff before it is applied with server-side apply.
On a PROD cluster you type the cluster name to confirm.
Learn more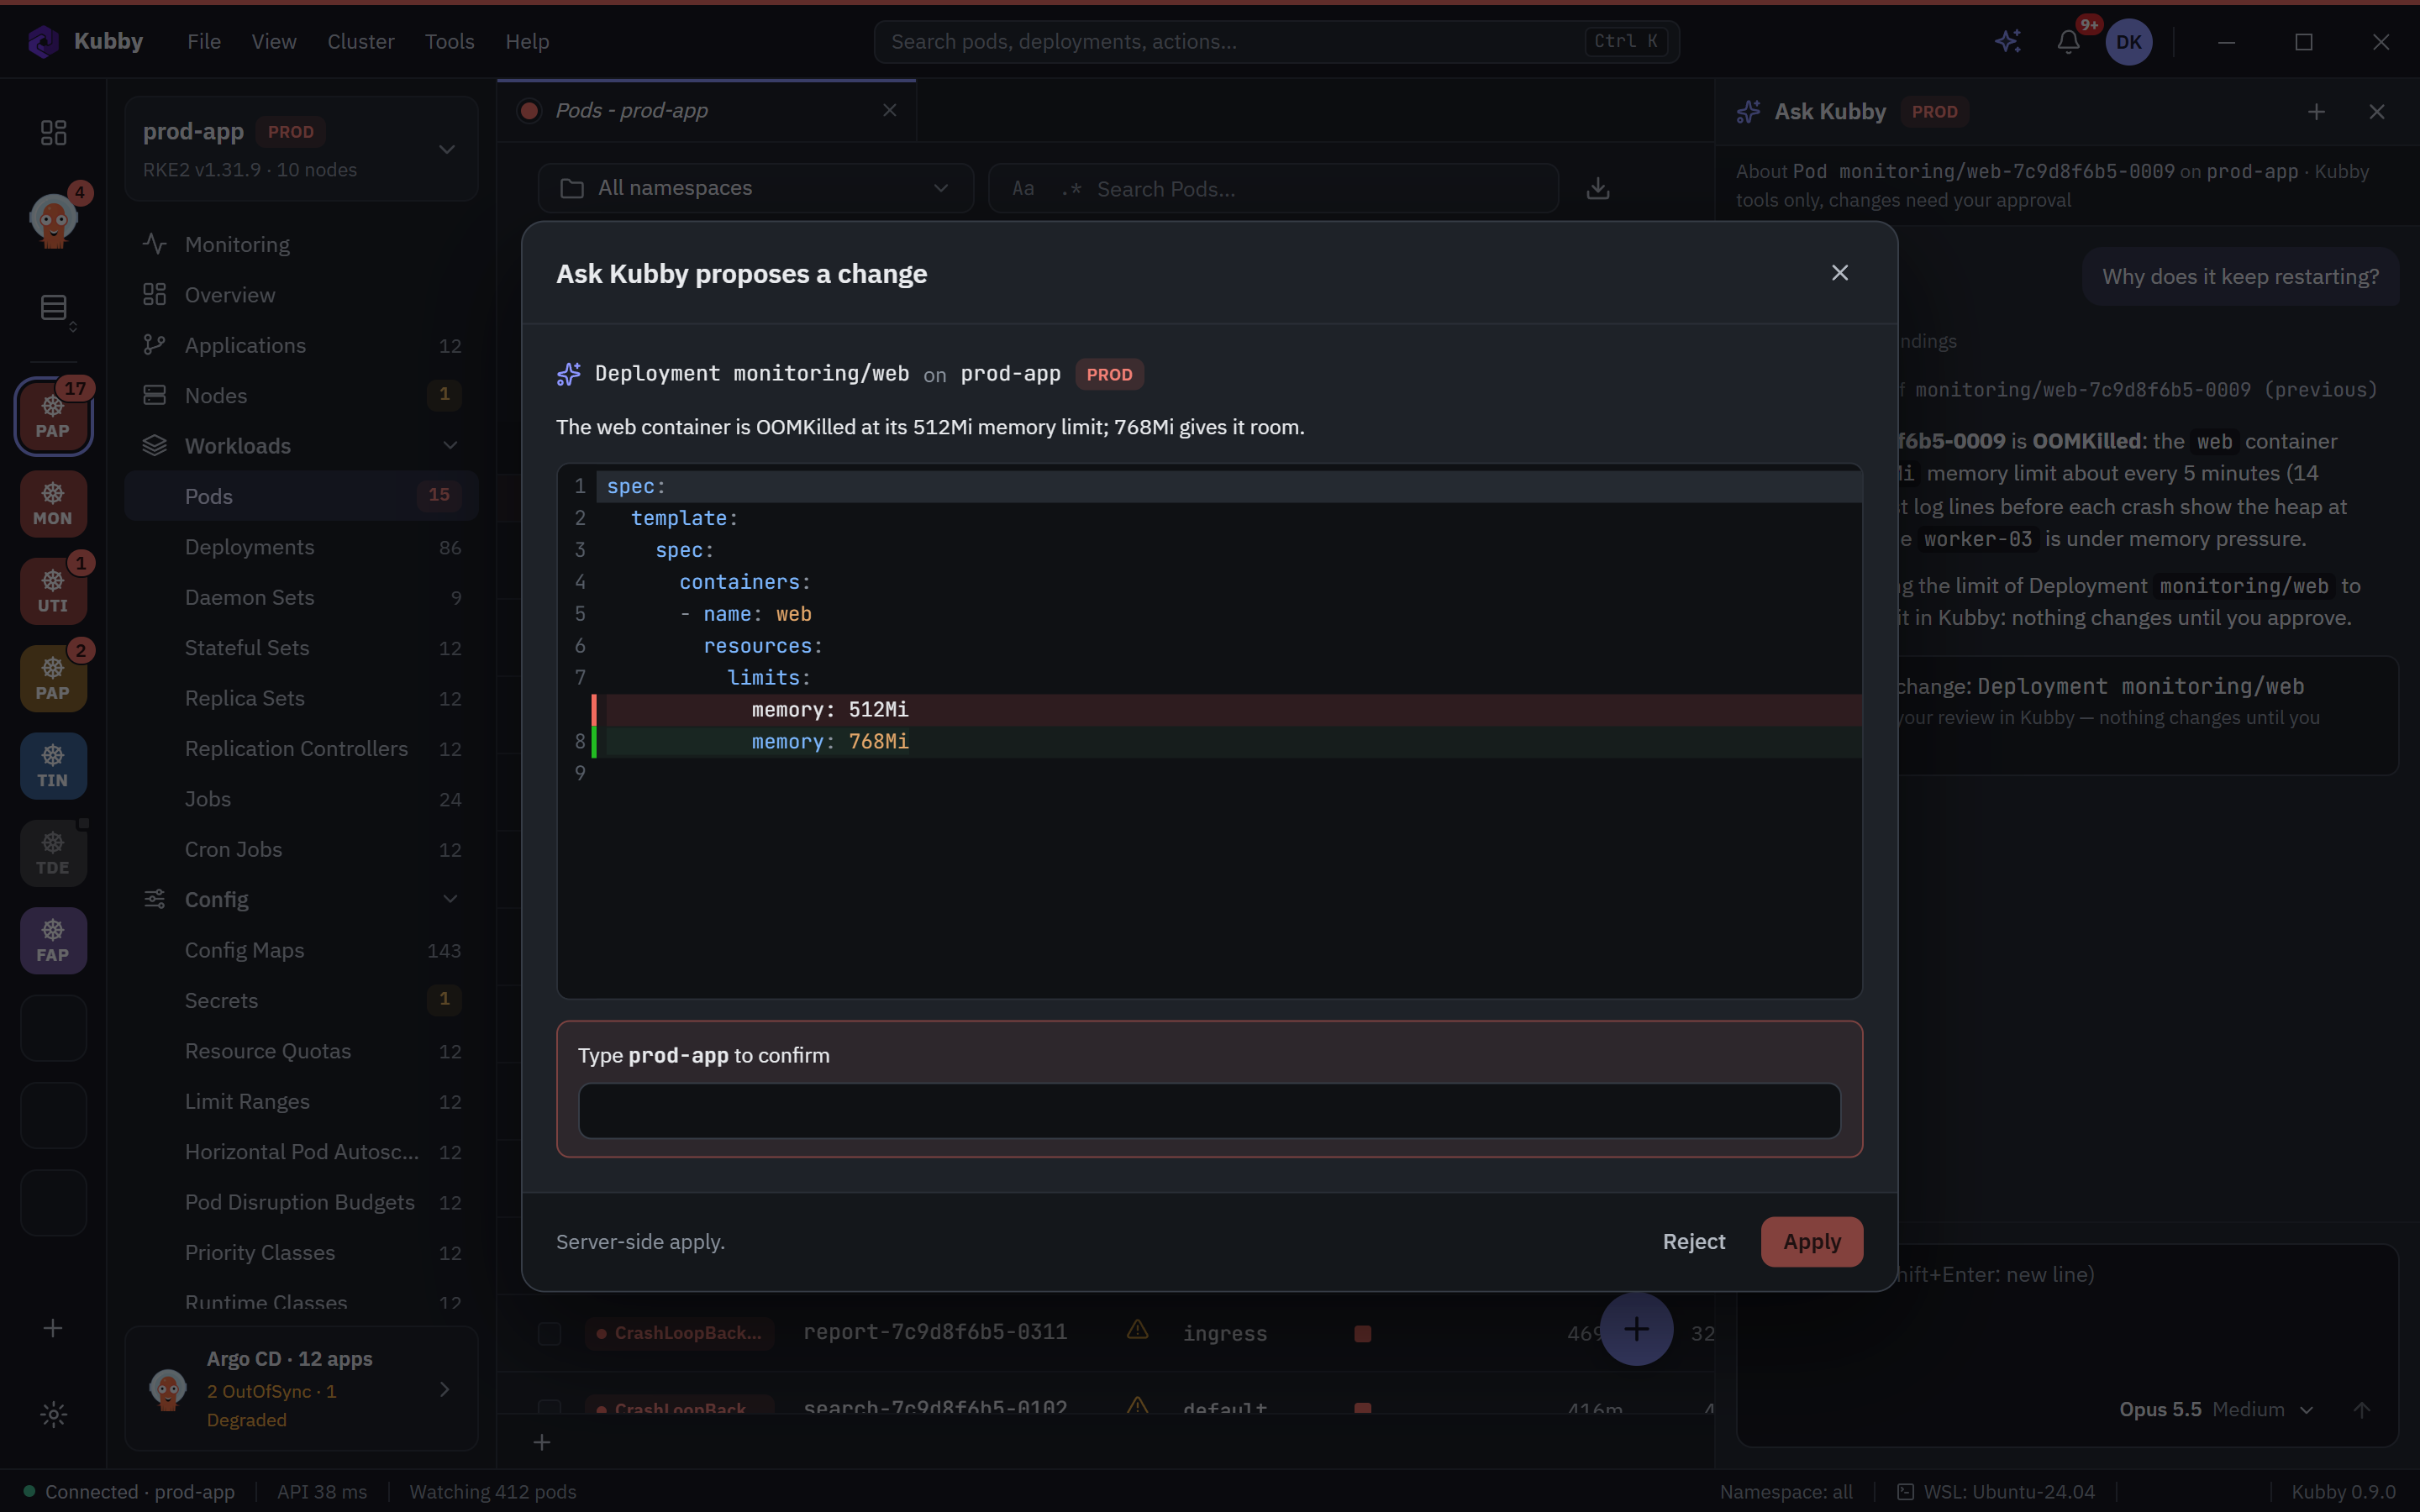
Live and previous logs of a pod or a whole workload, with levels, search and a restart history above.
Pick the crashed run and read the last lines before it died.
Learn more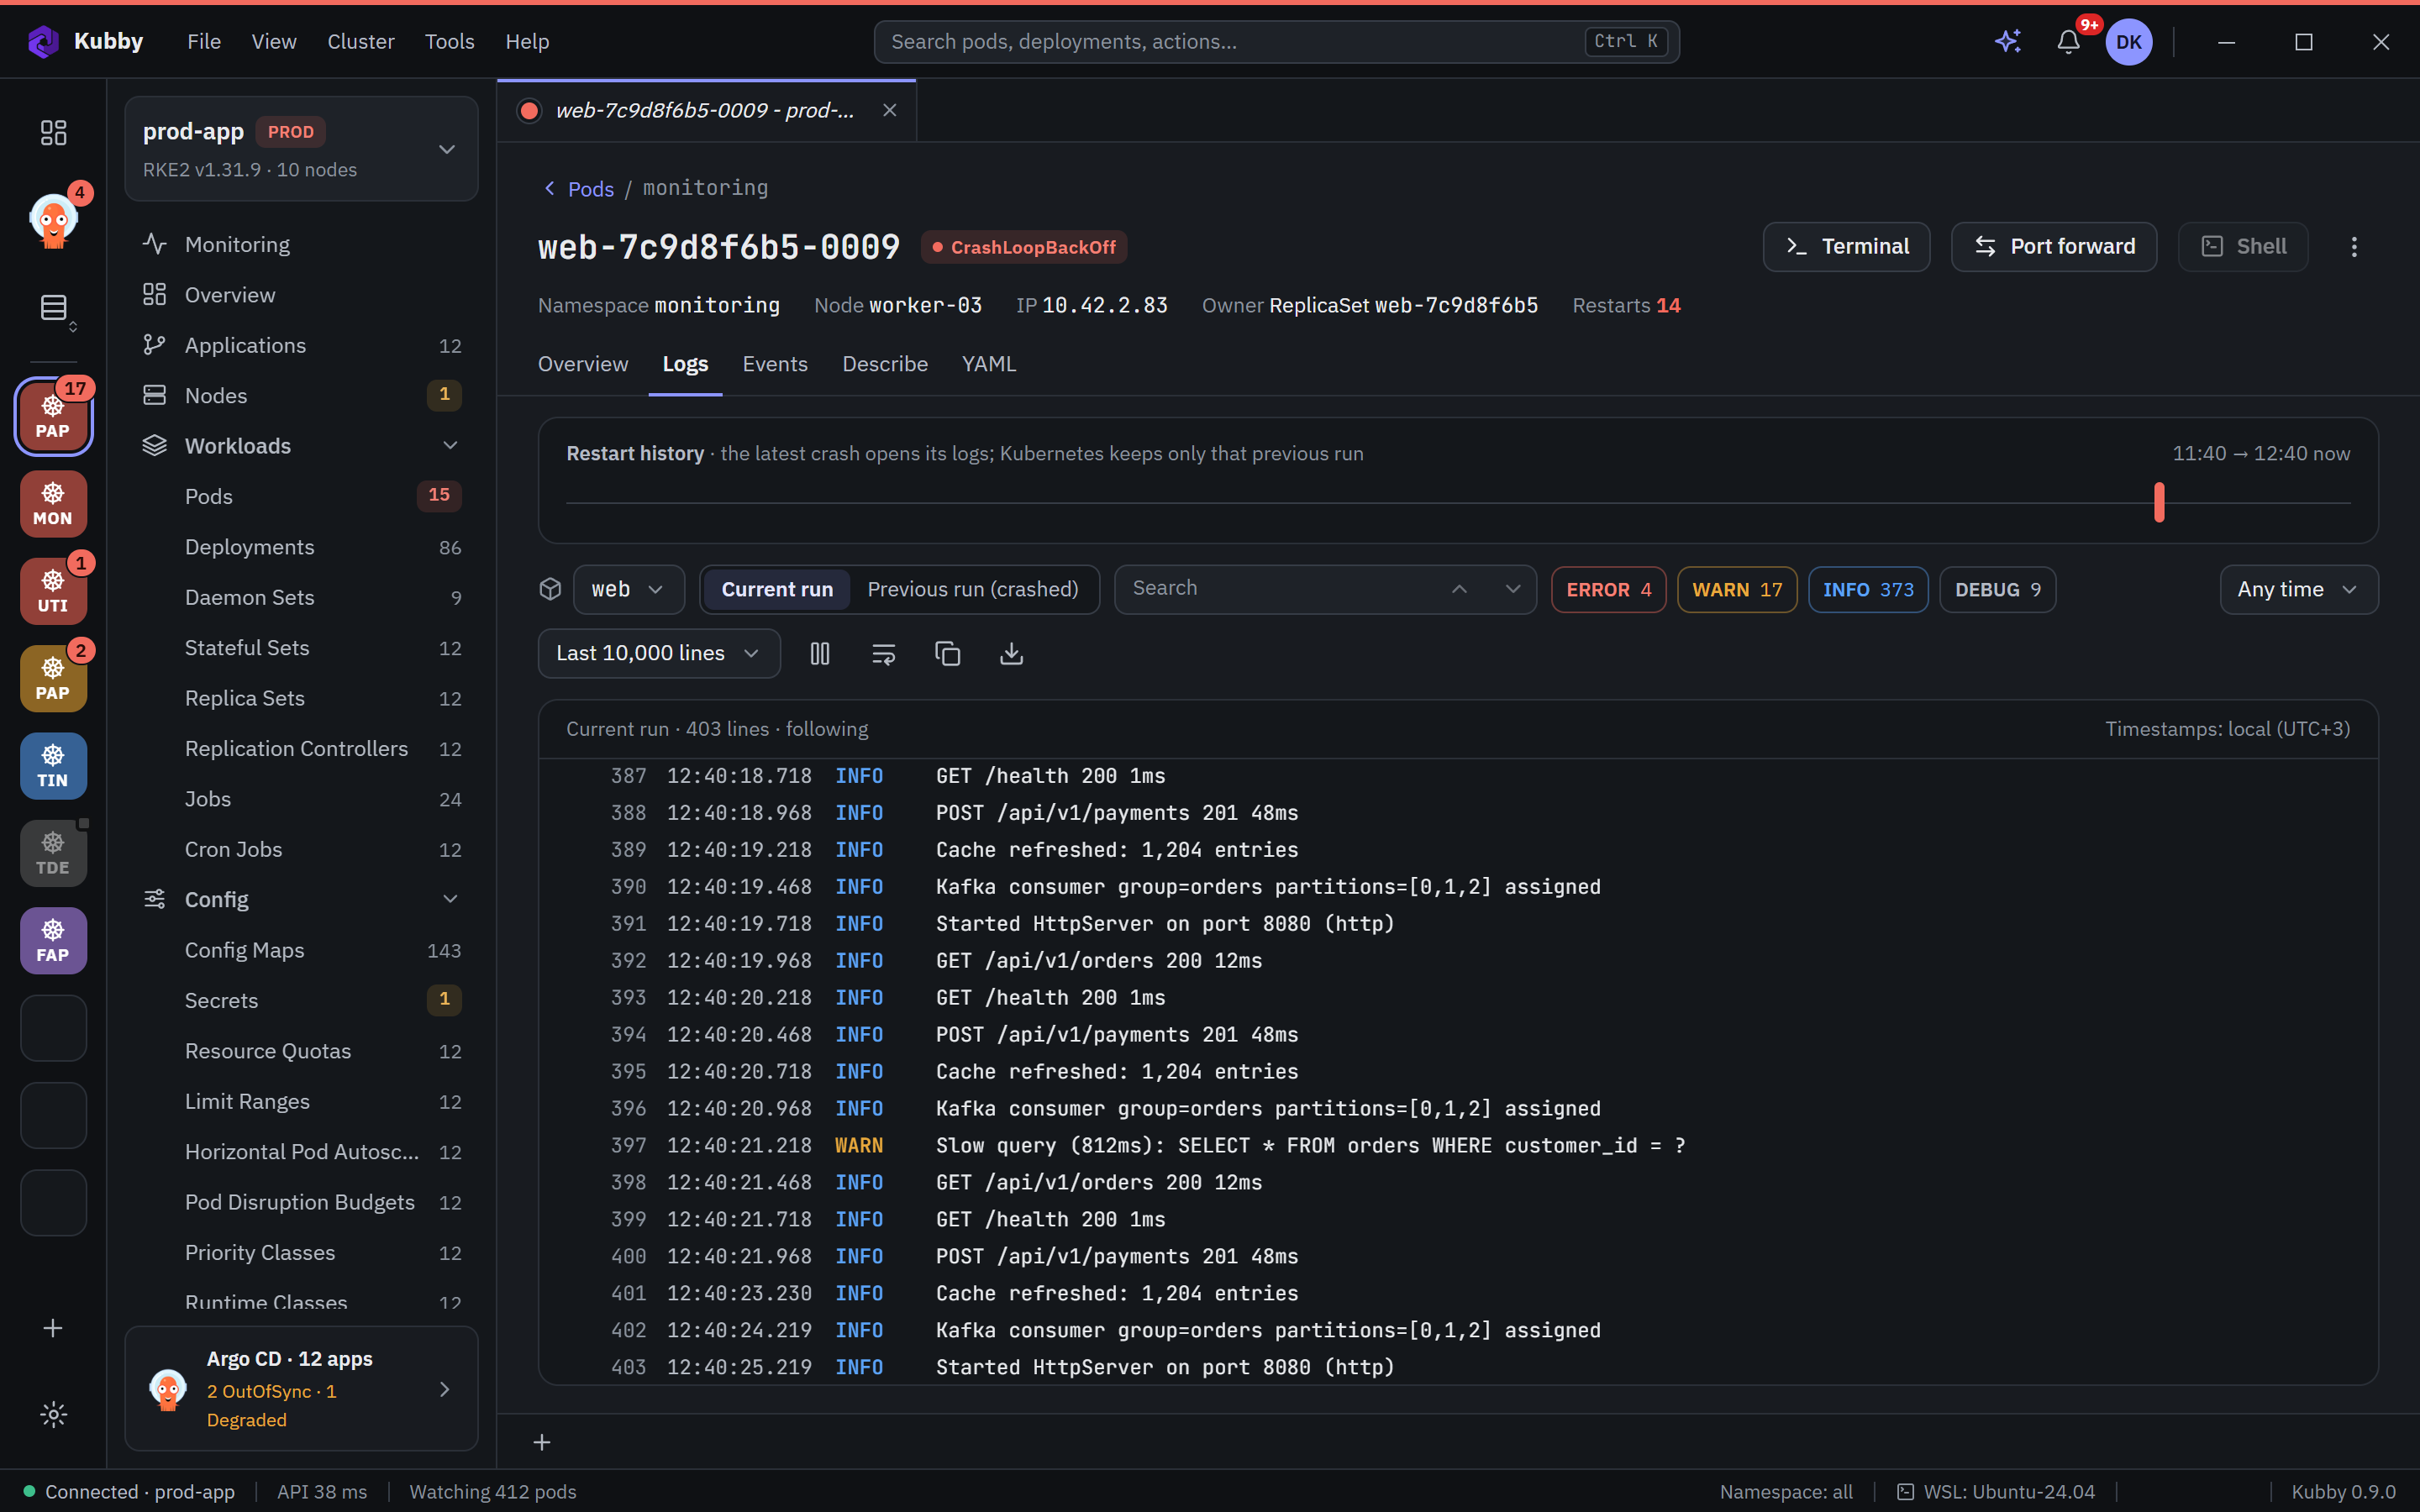
Pick deployments, labels or whole namespaces: the logs of every pod and container run in one live timeline, with pod starts, kills and events between the lines.
Log volume, levels, the busiest pods and the restarts on top; one click jumps to the crash.
Learn more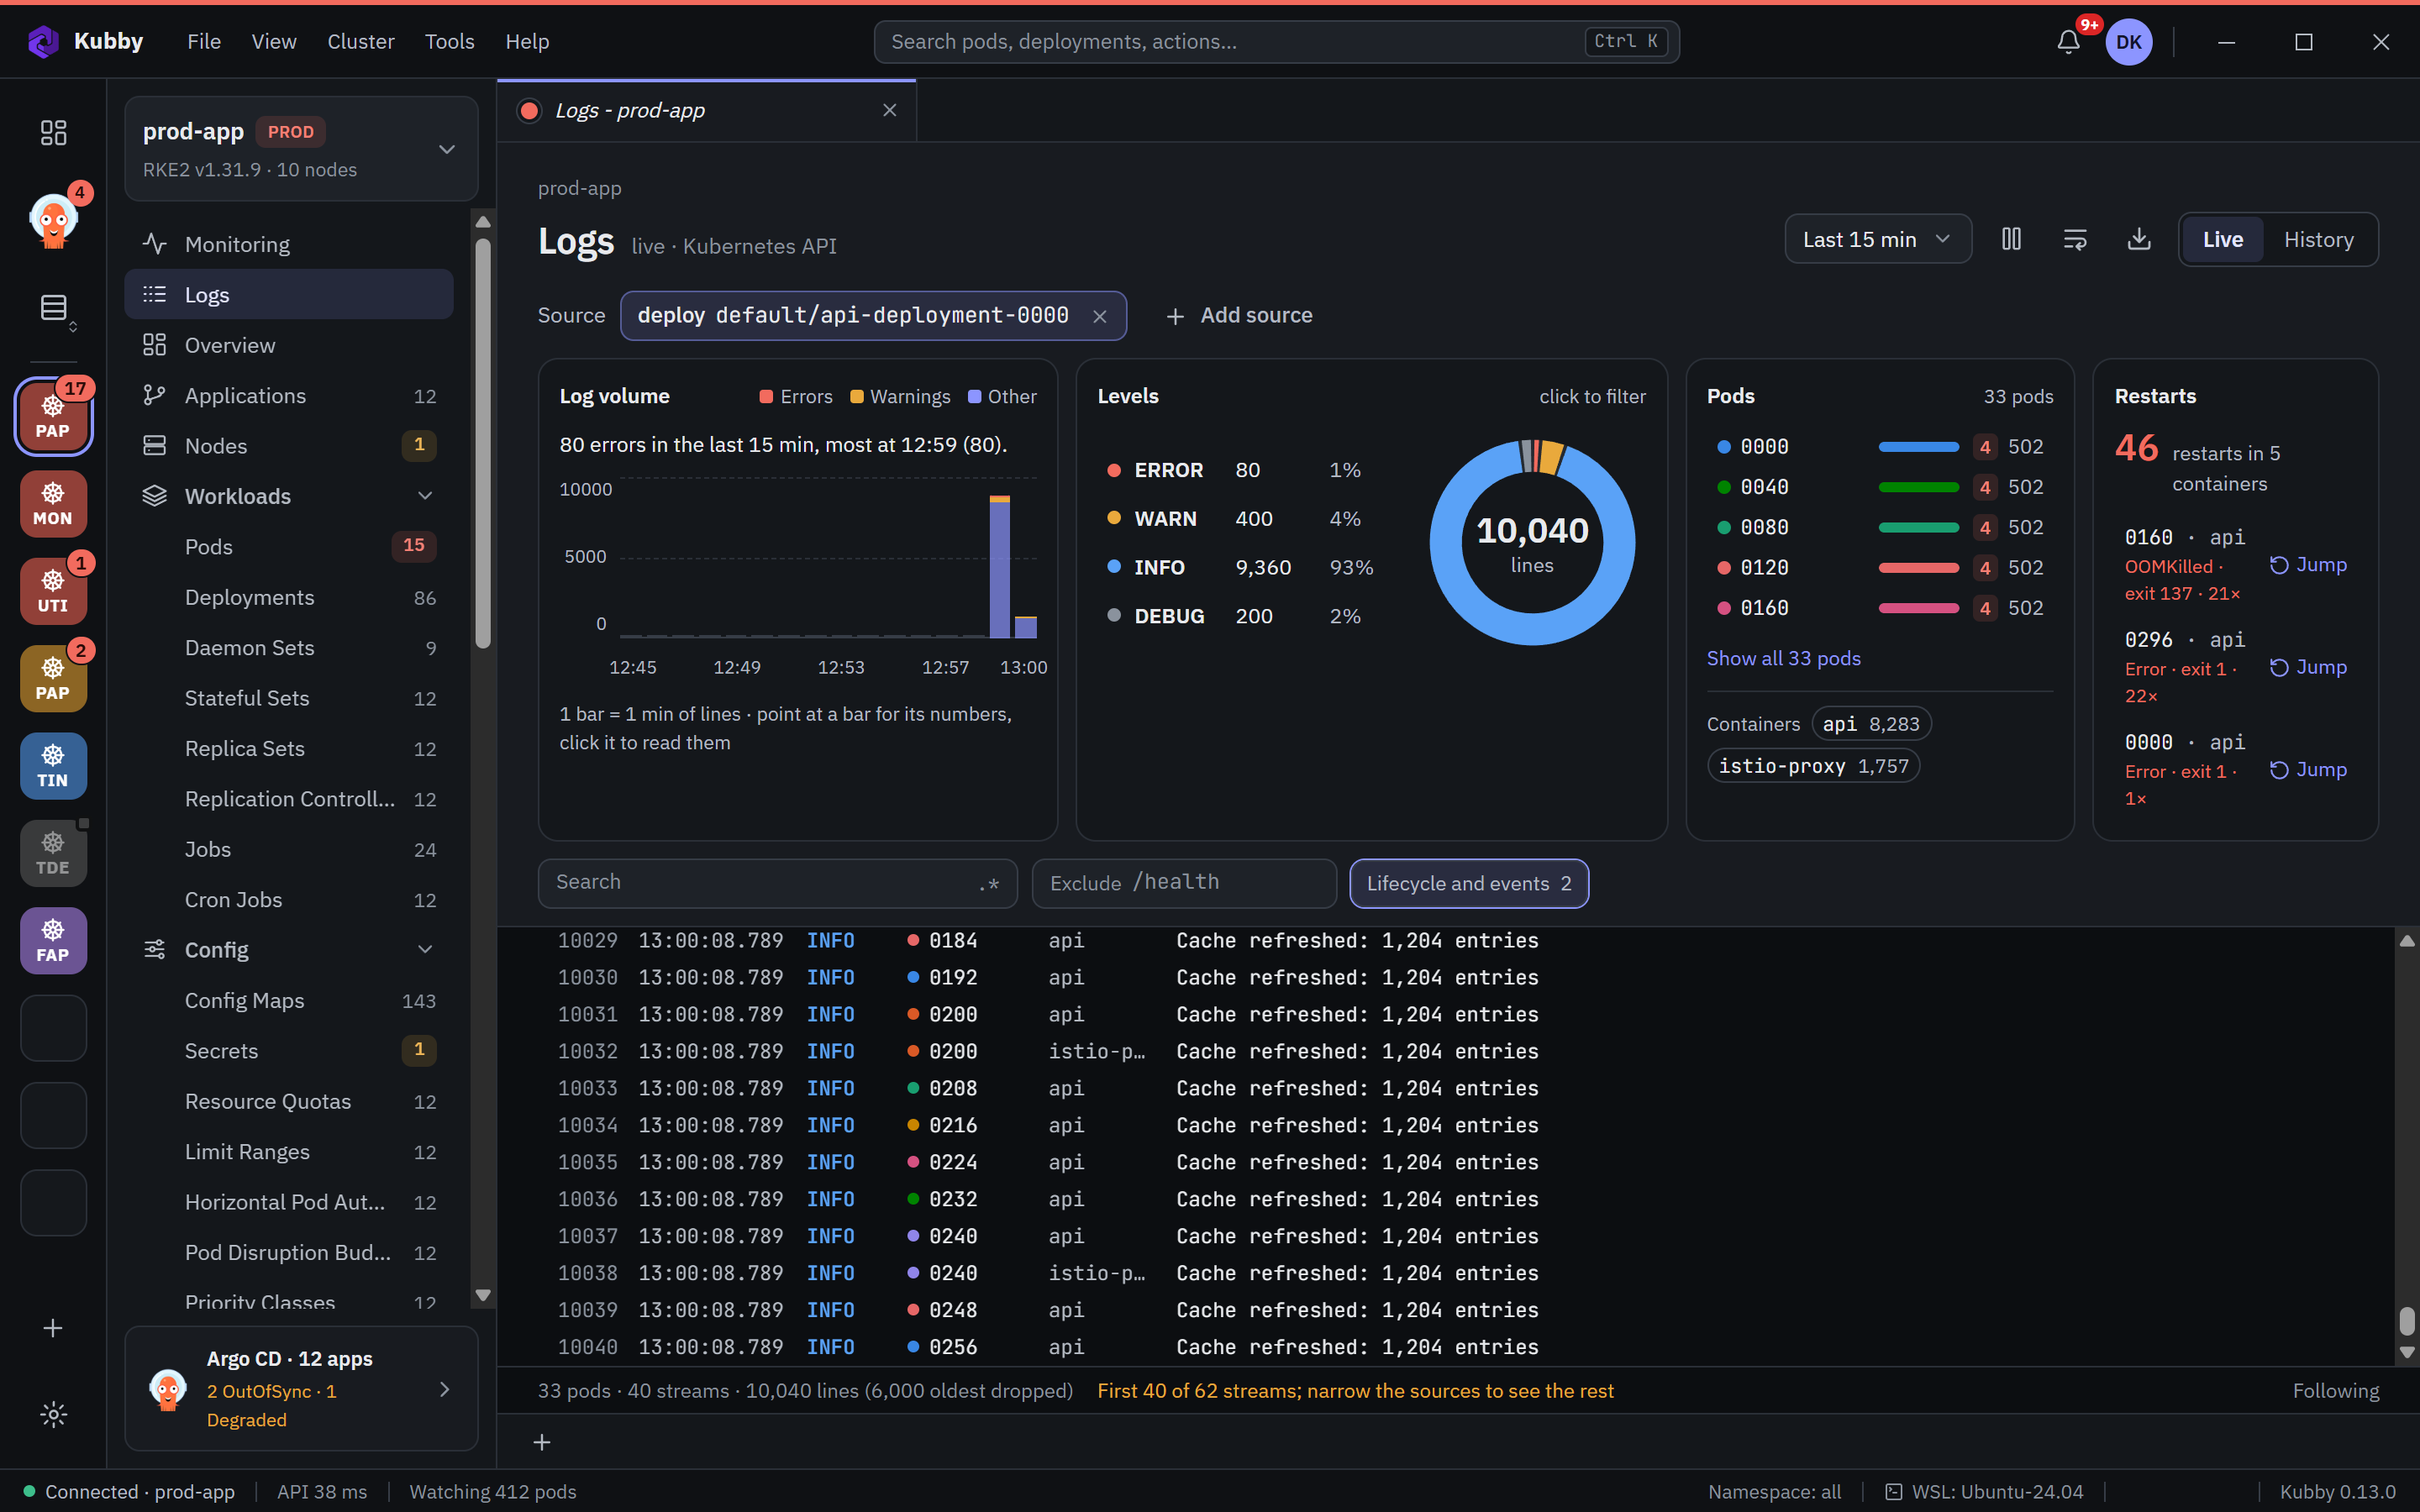
History searches Loki, Elasticsearch or OpenSearch, found in the cluster or added once as a central store, so the logs of deleted pods and the node's kubelet and containerd logs are still there.
Passwords stay in Kubernetes Secrets you create; Kubby keeps only the reference.
Learn more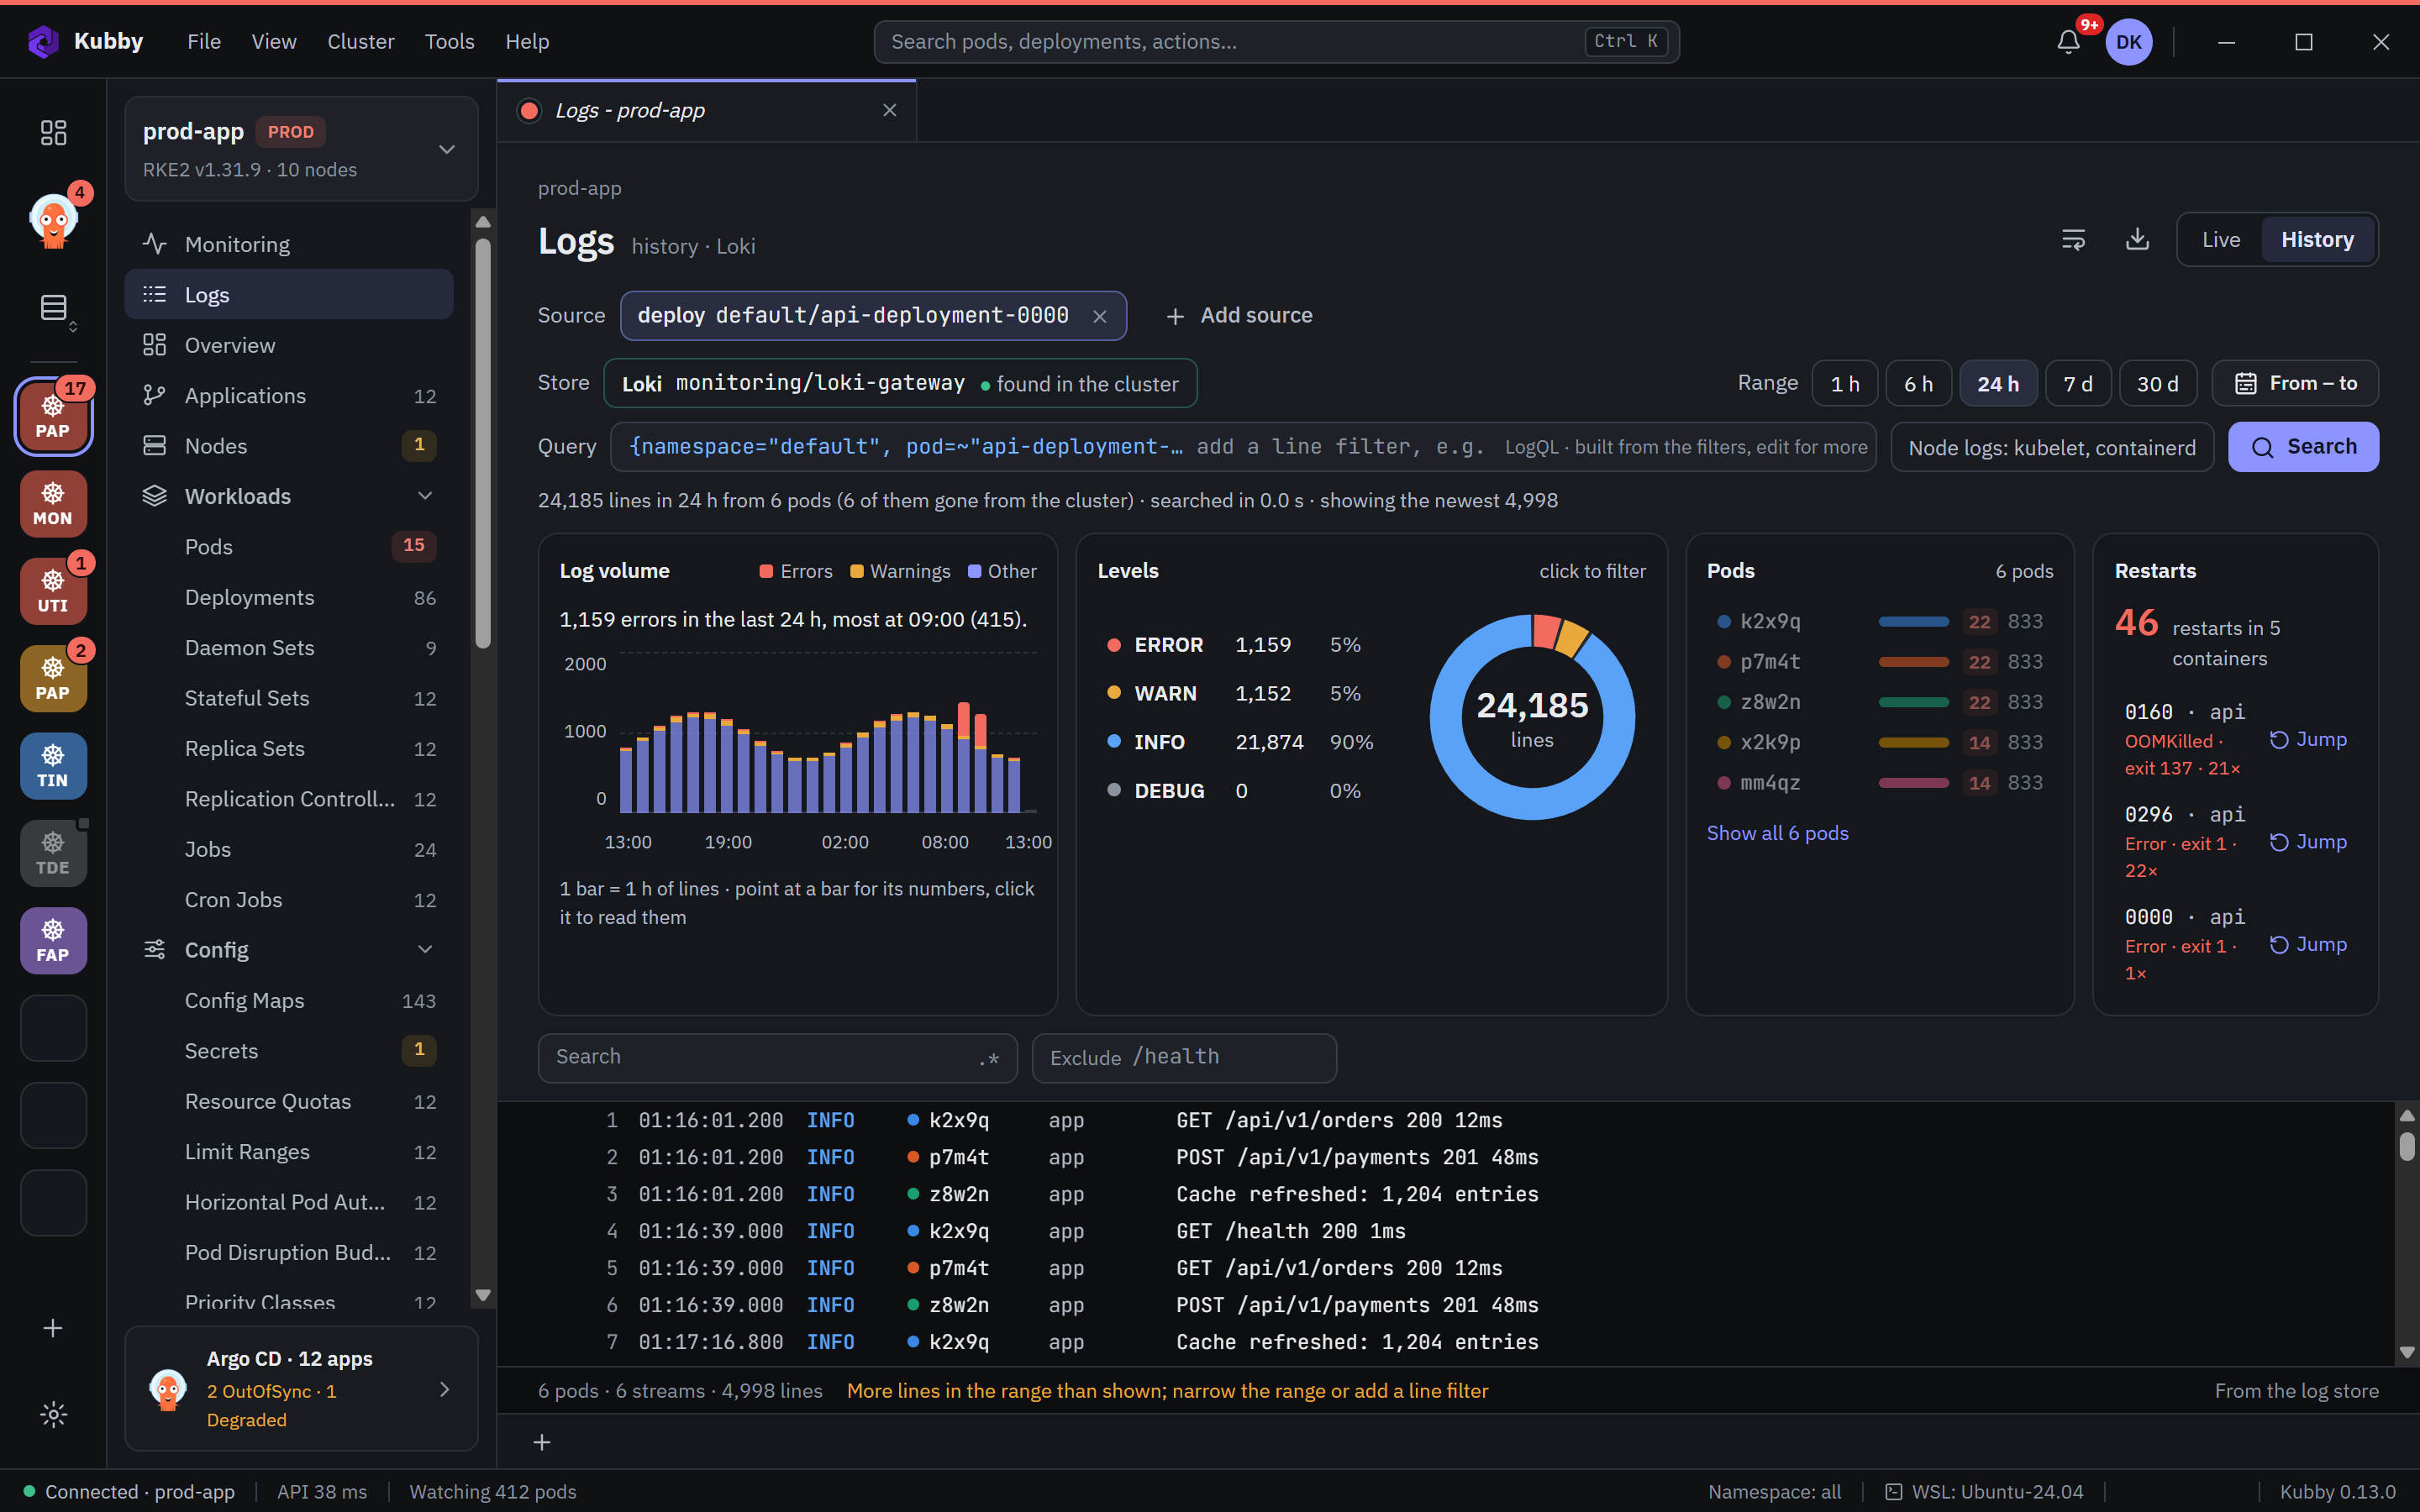
Environment colours on every screen, and the cluster name typed before scaling, deleting or rolling back on PROD.
Everything you change is written to the audit log.
Learn more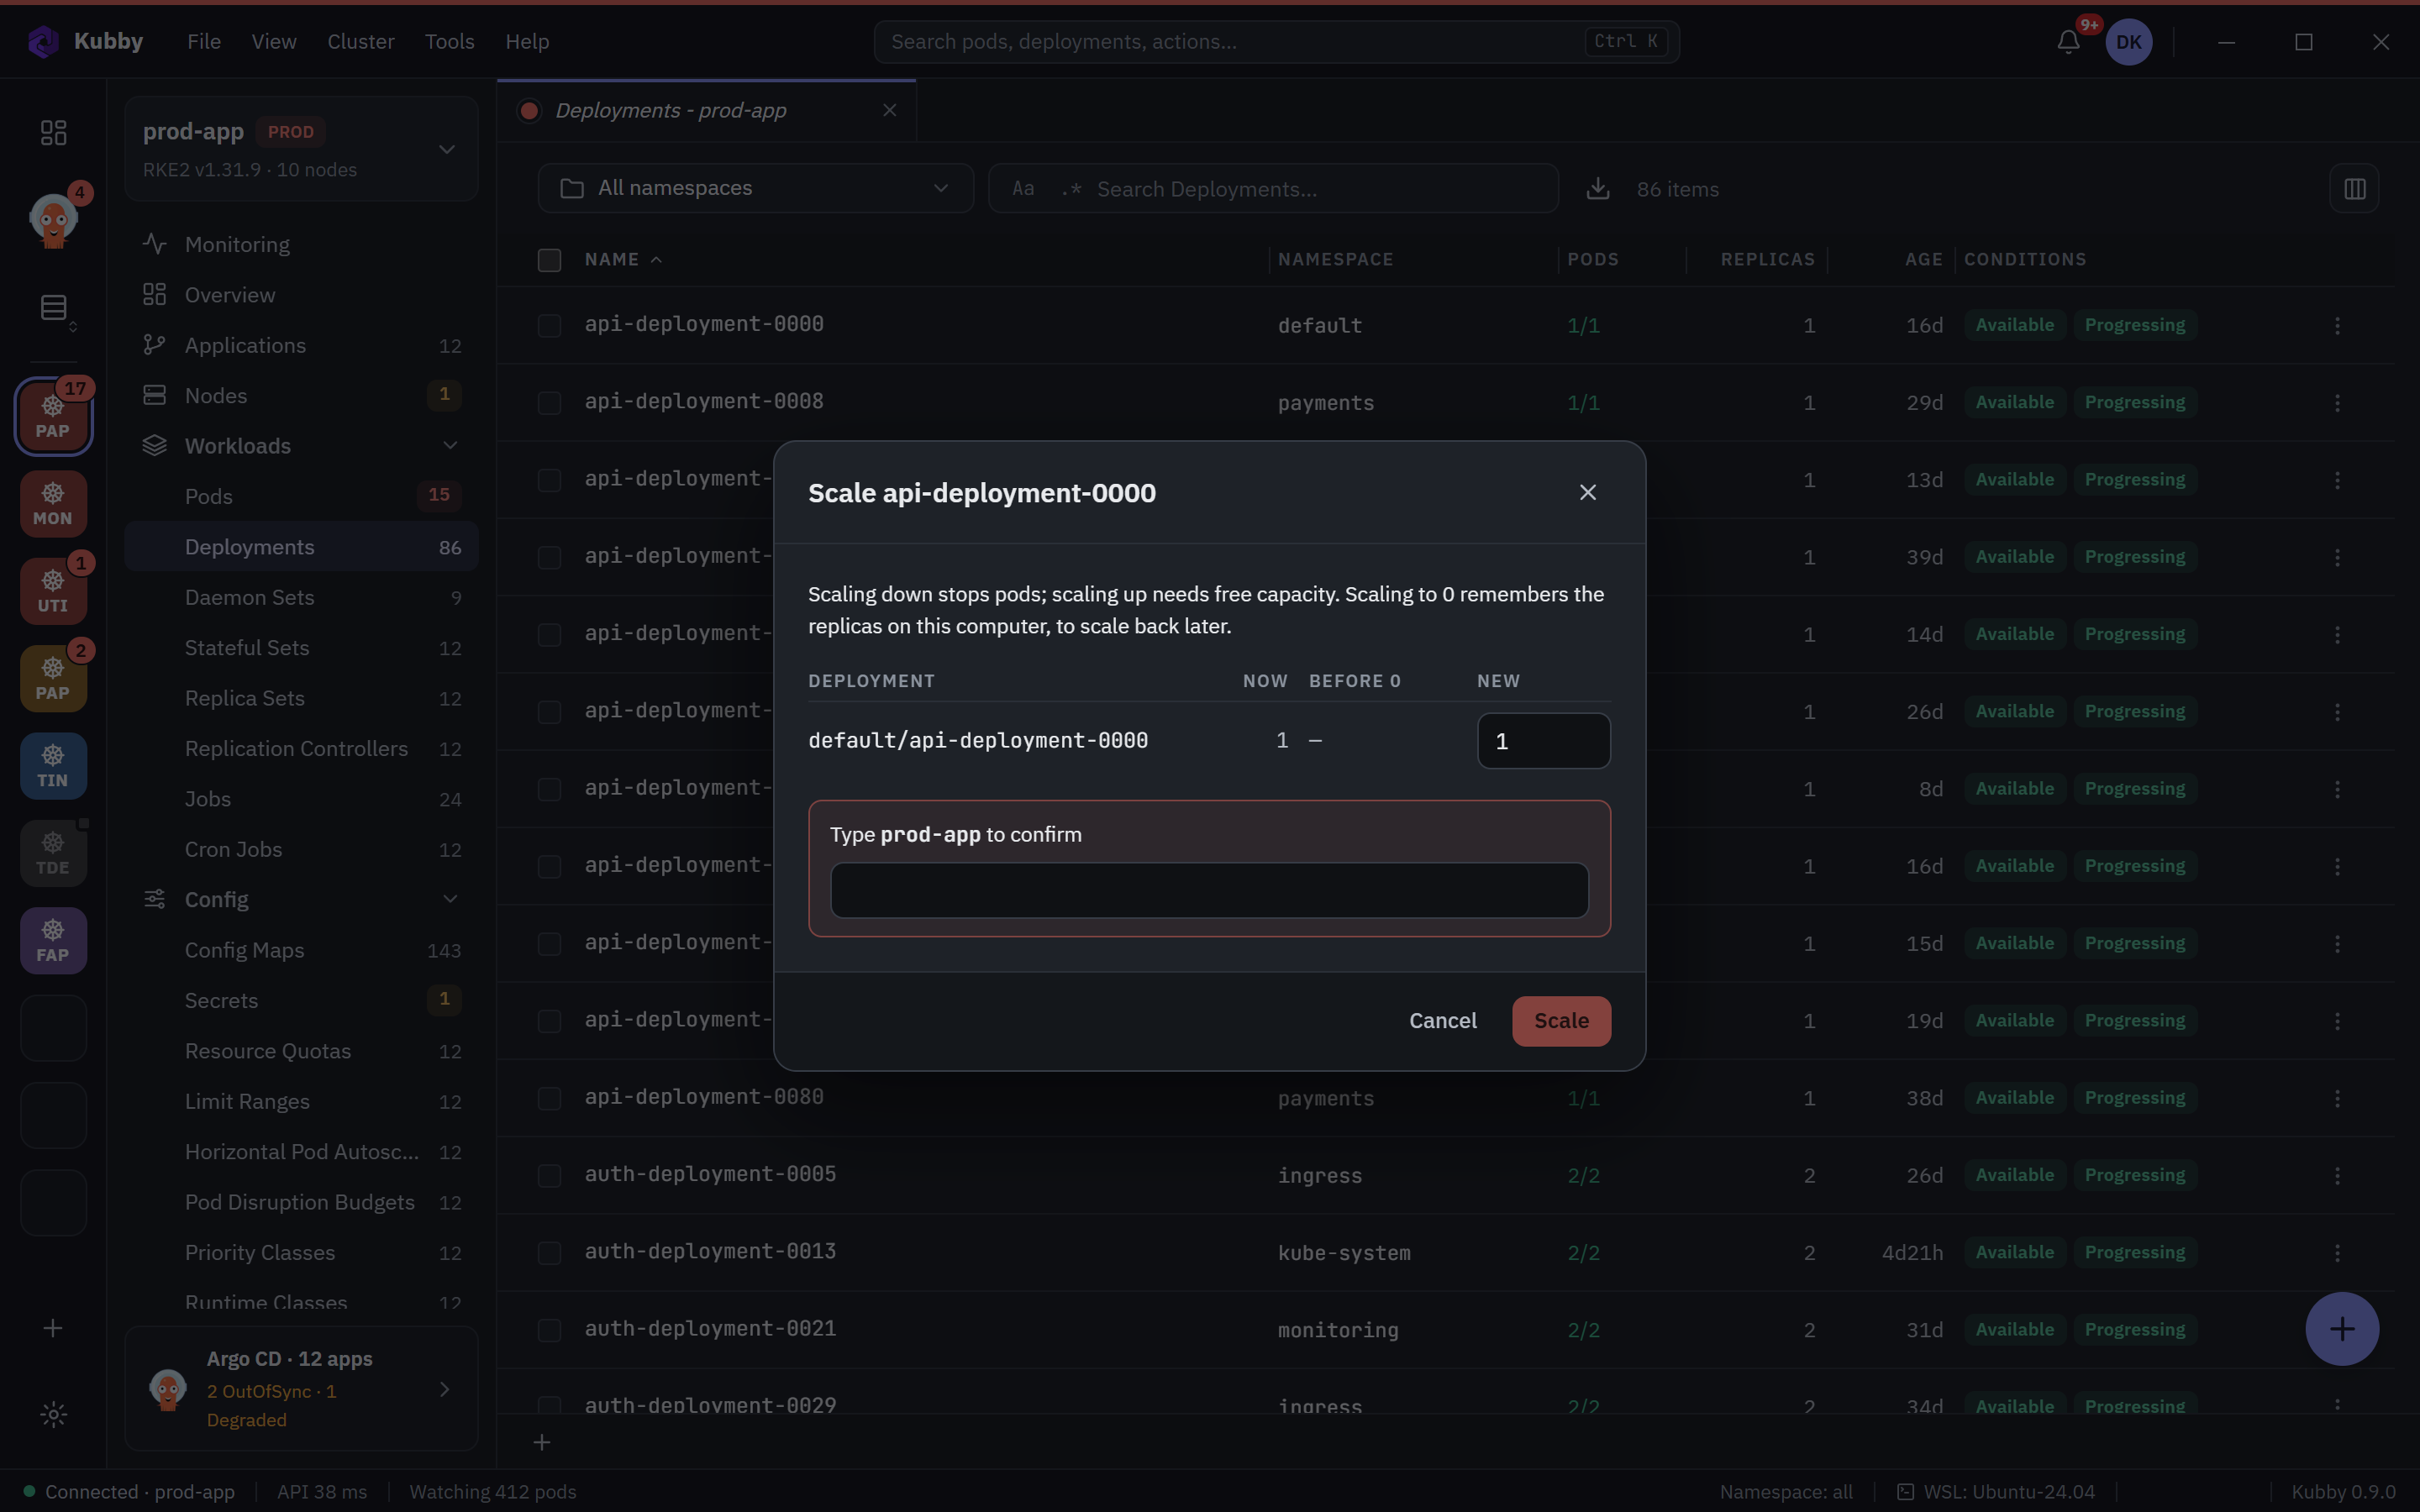
Kubby finds the cluster's Prometheus and shows capacity, workloads, control plane, etcd, storage, network and certificates.
Ranges from 5 minutes to 7 days.
Learn more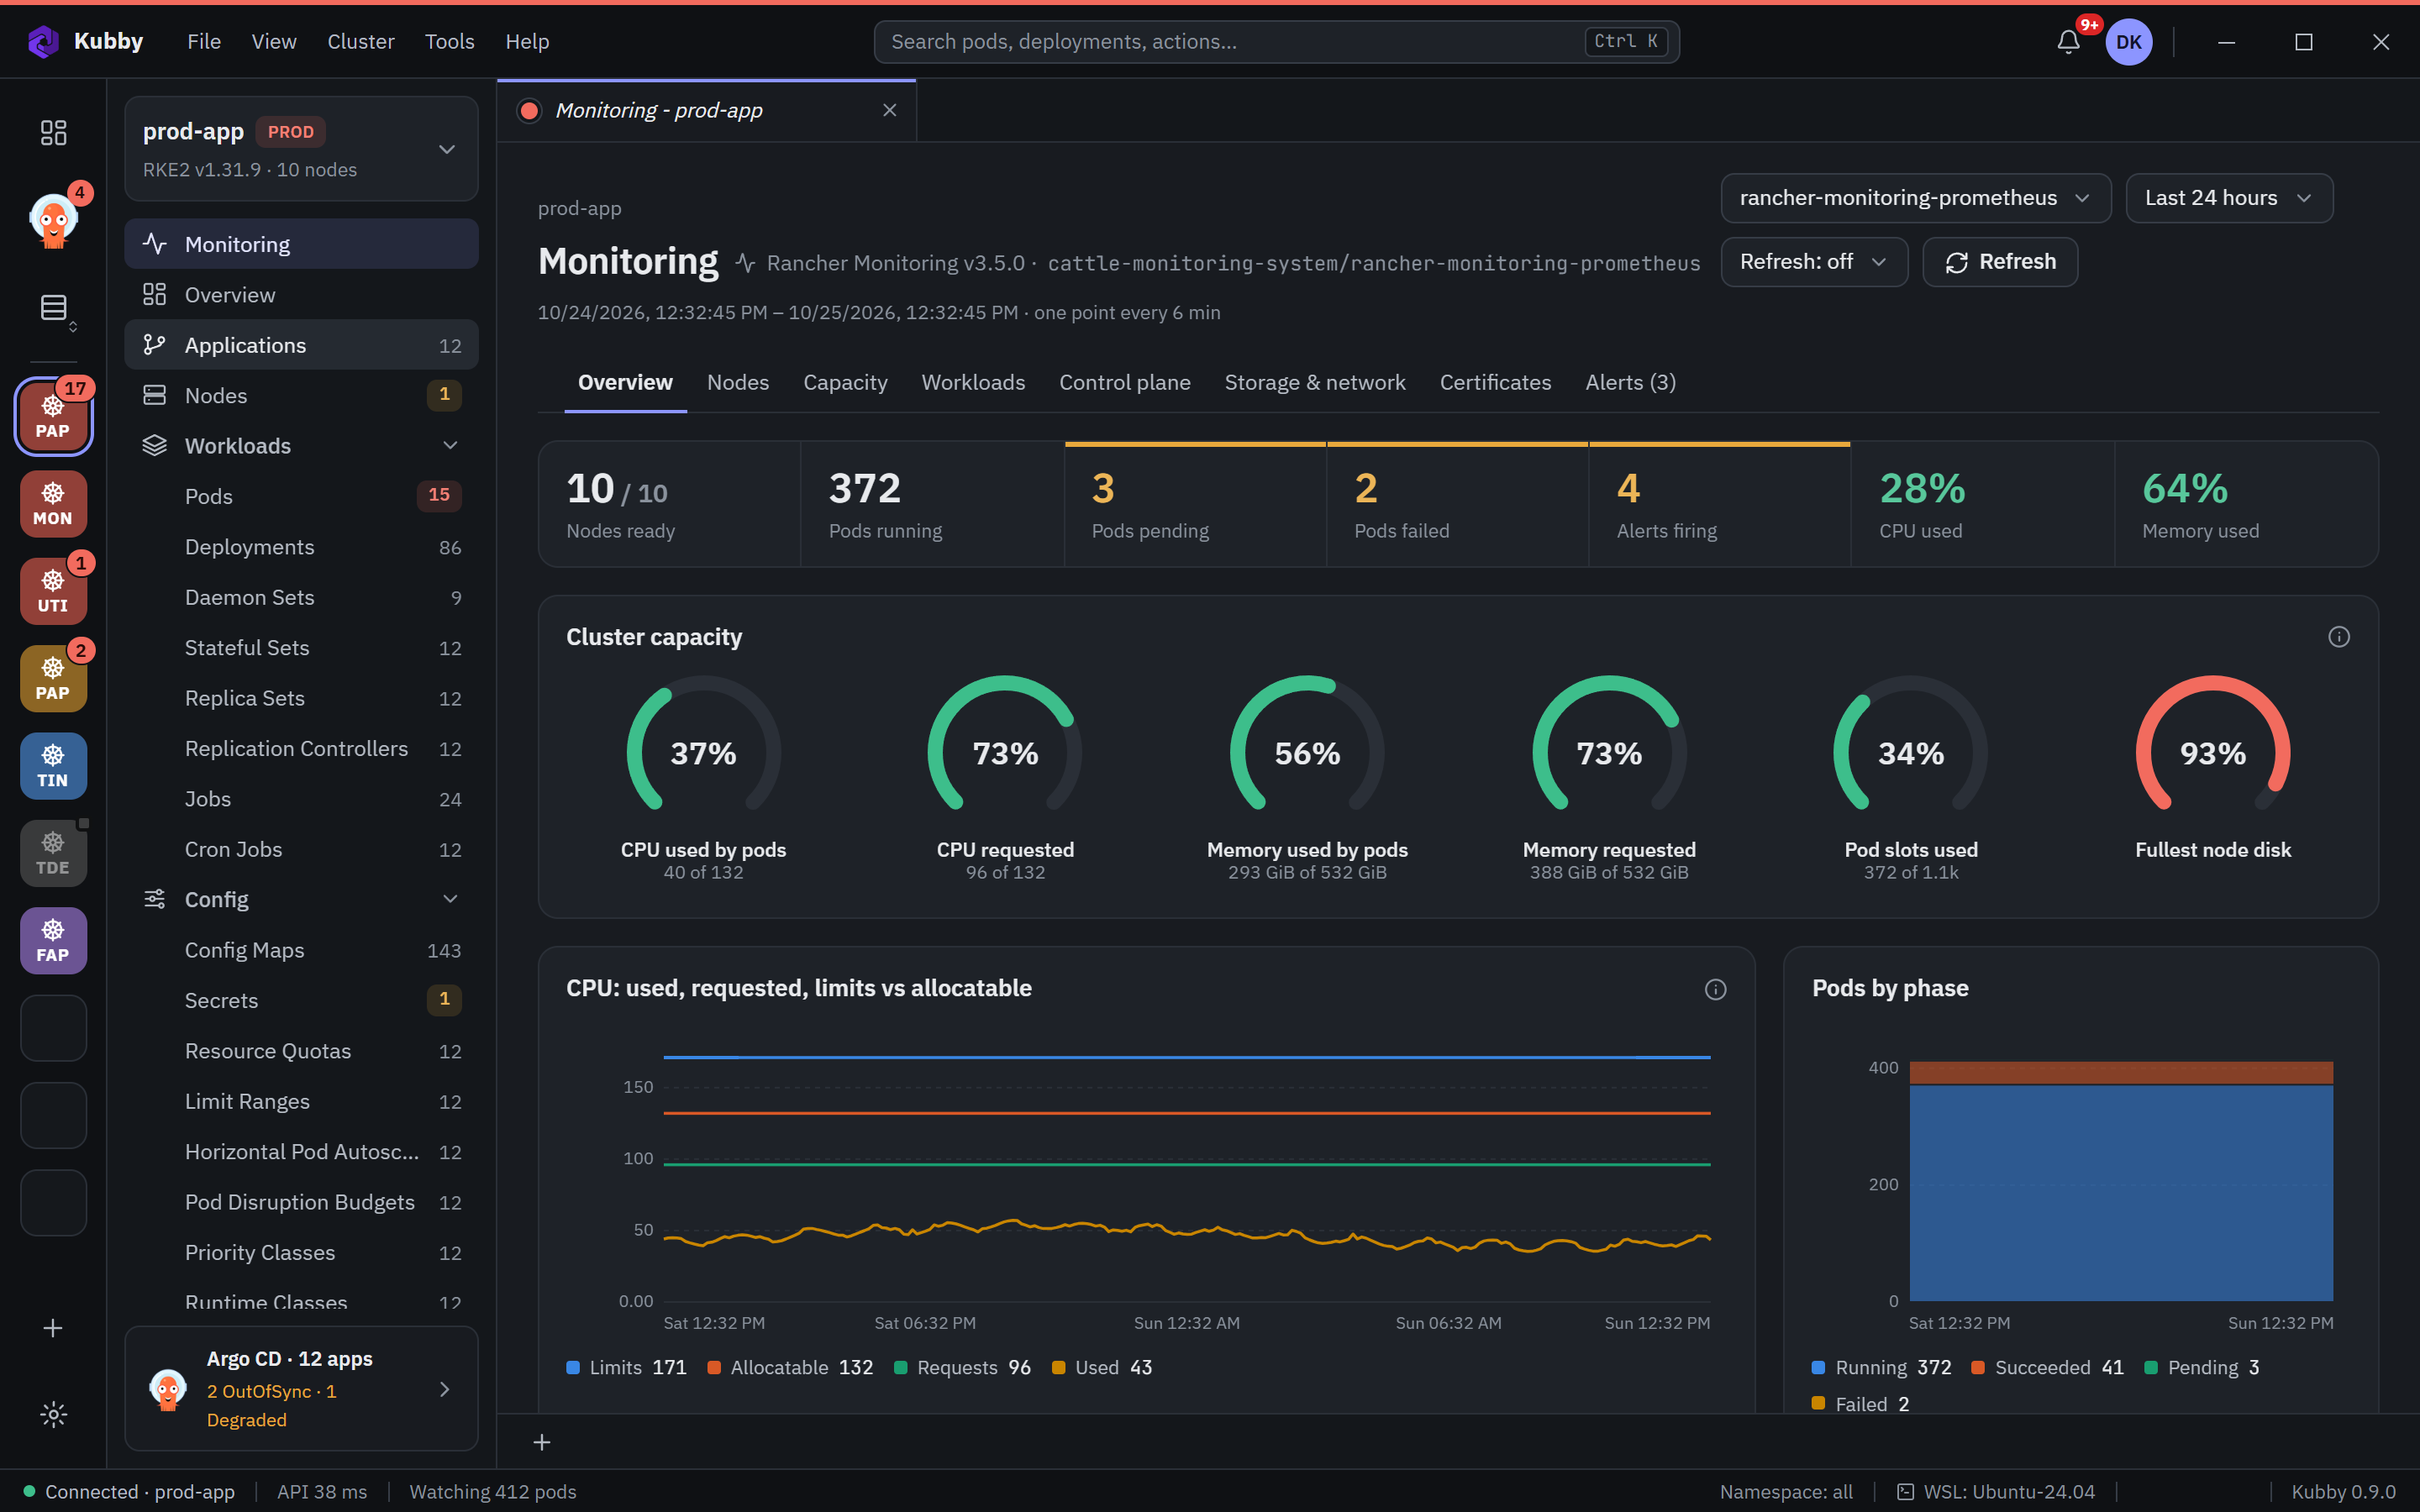
A cluster without a log store or Prometheus gets an offer: Loki with Alloy, or a small Prometheus, from your private registry if you have one.
Before anything is installed you see the CPU, memory and disk it uses on your nodes, the rights it needs and the images. You approve it, it is audited, and Kubby connects to it.
Learn more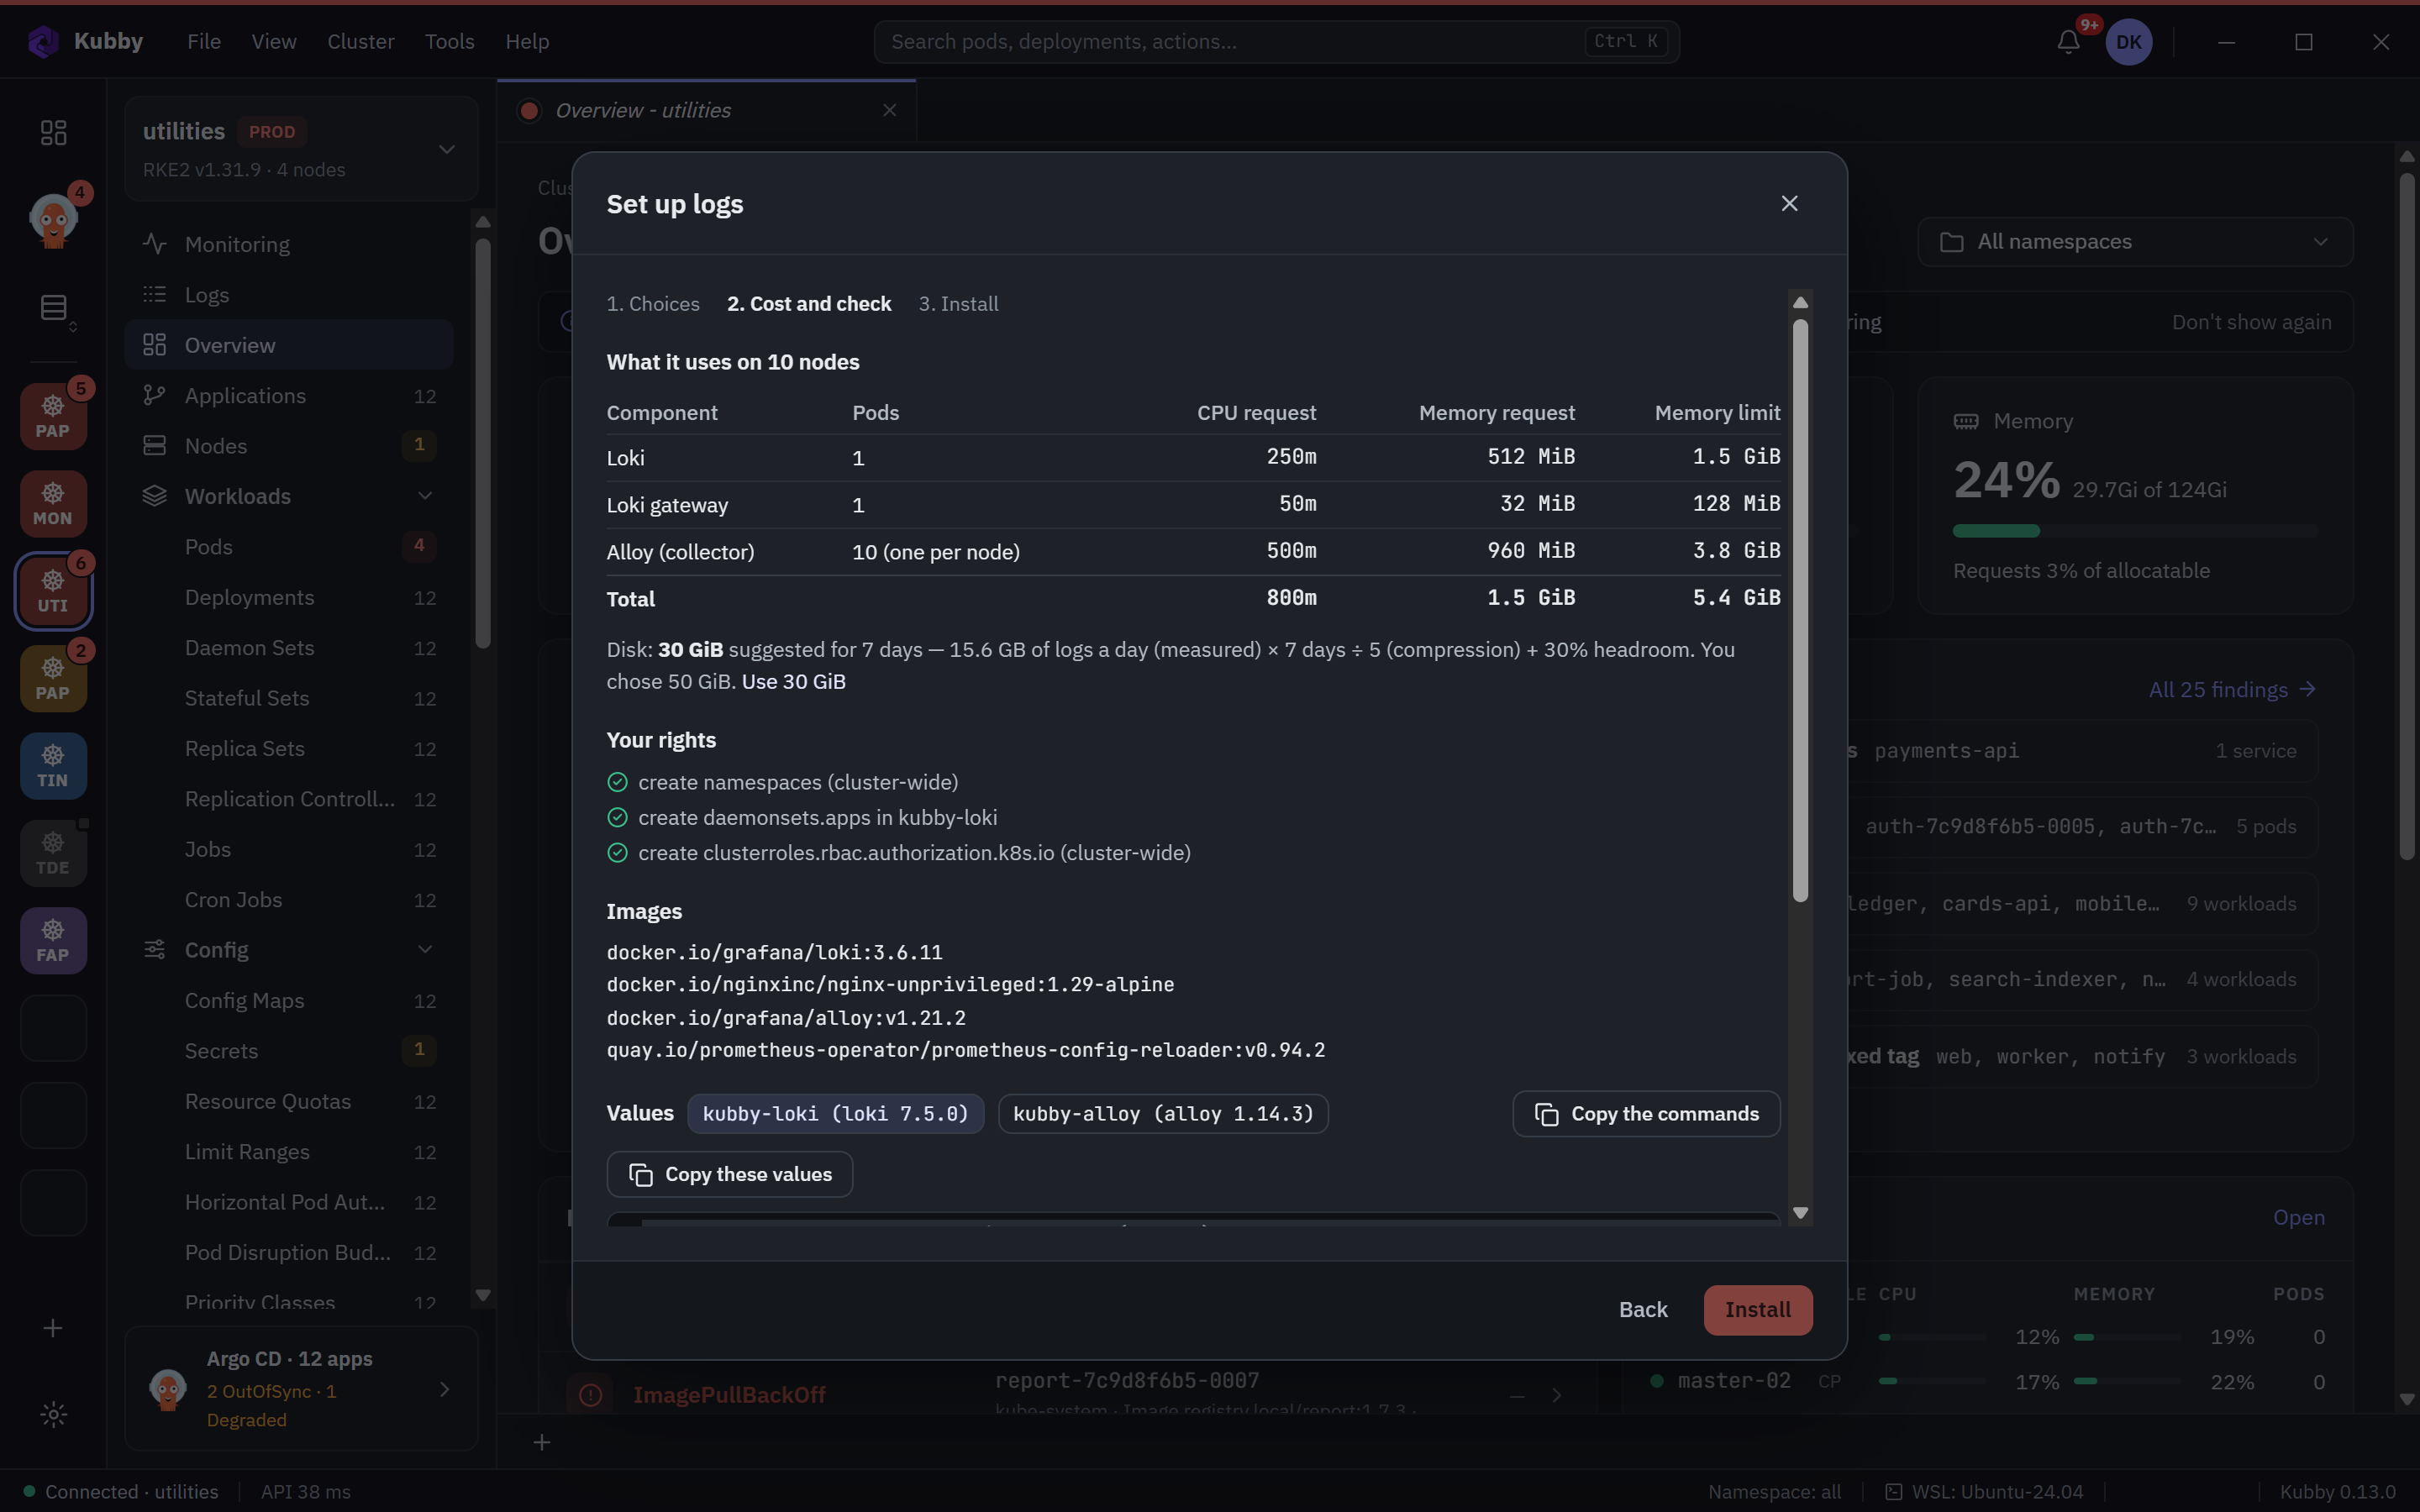
Nodes ready, average CPU and memory, the fullest disk and nodes under pressure.
Click a node for its disks, OS, kernel, uptime and heaviest pods.
Learn more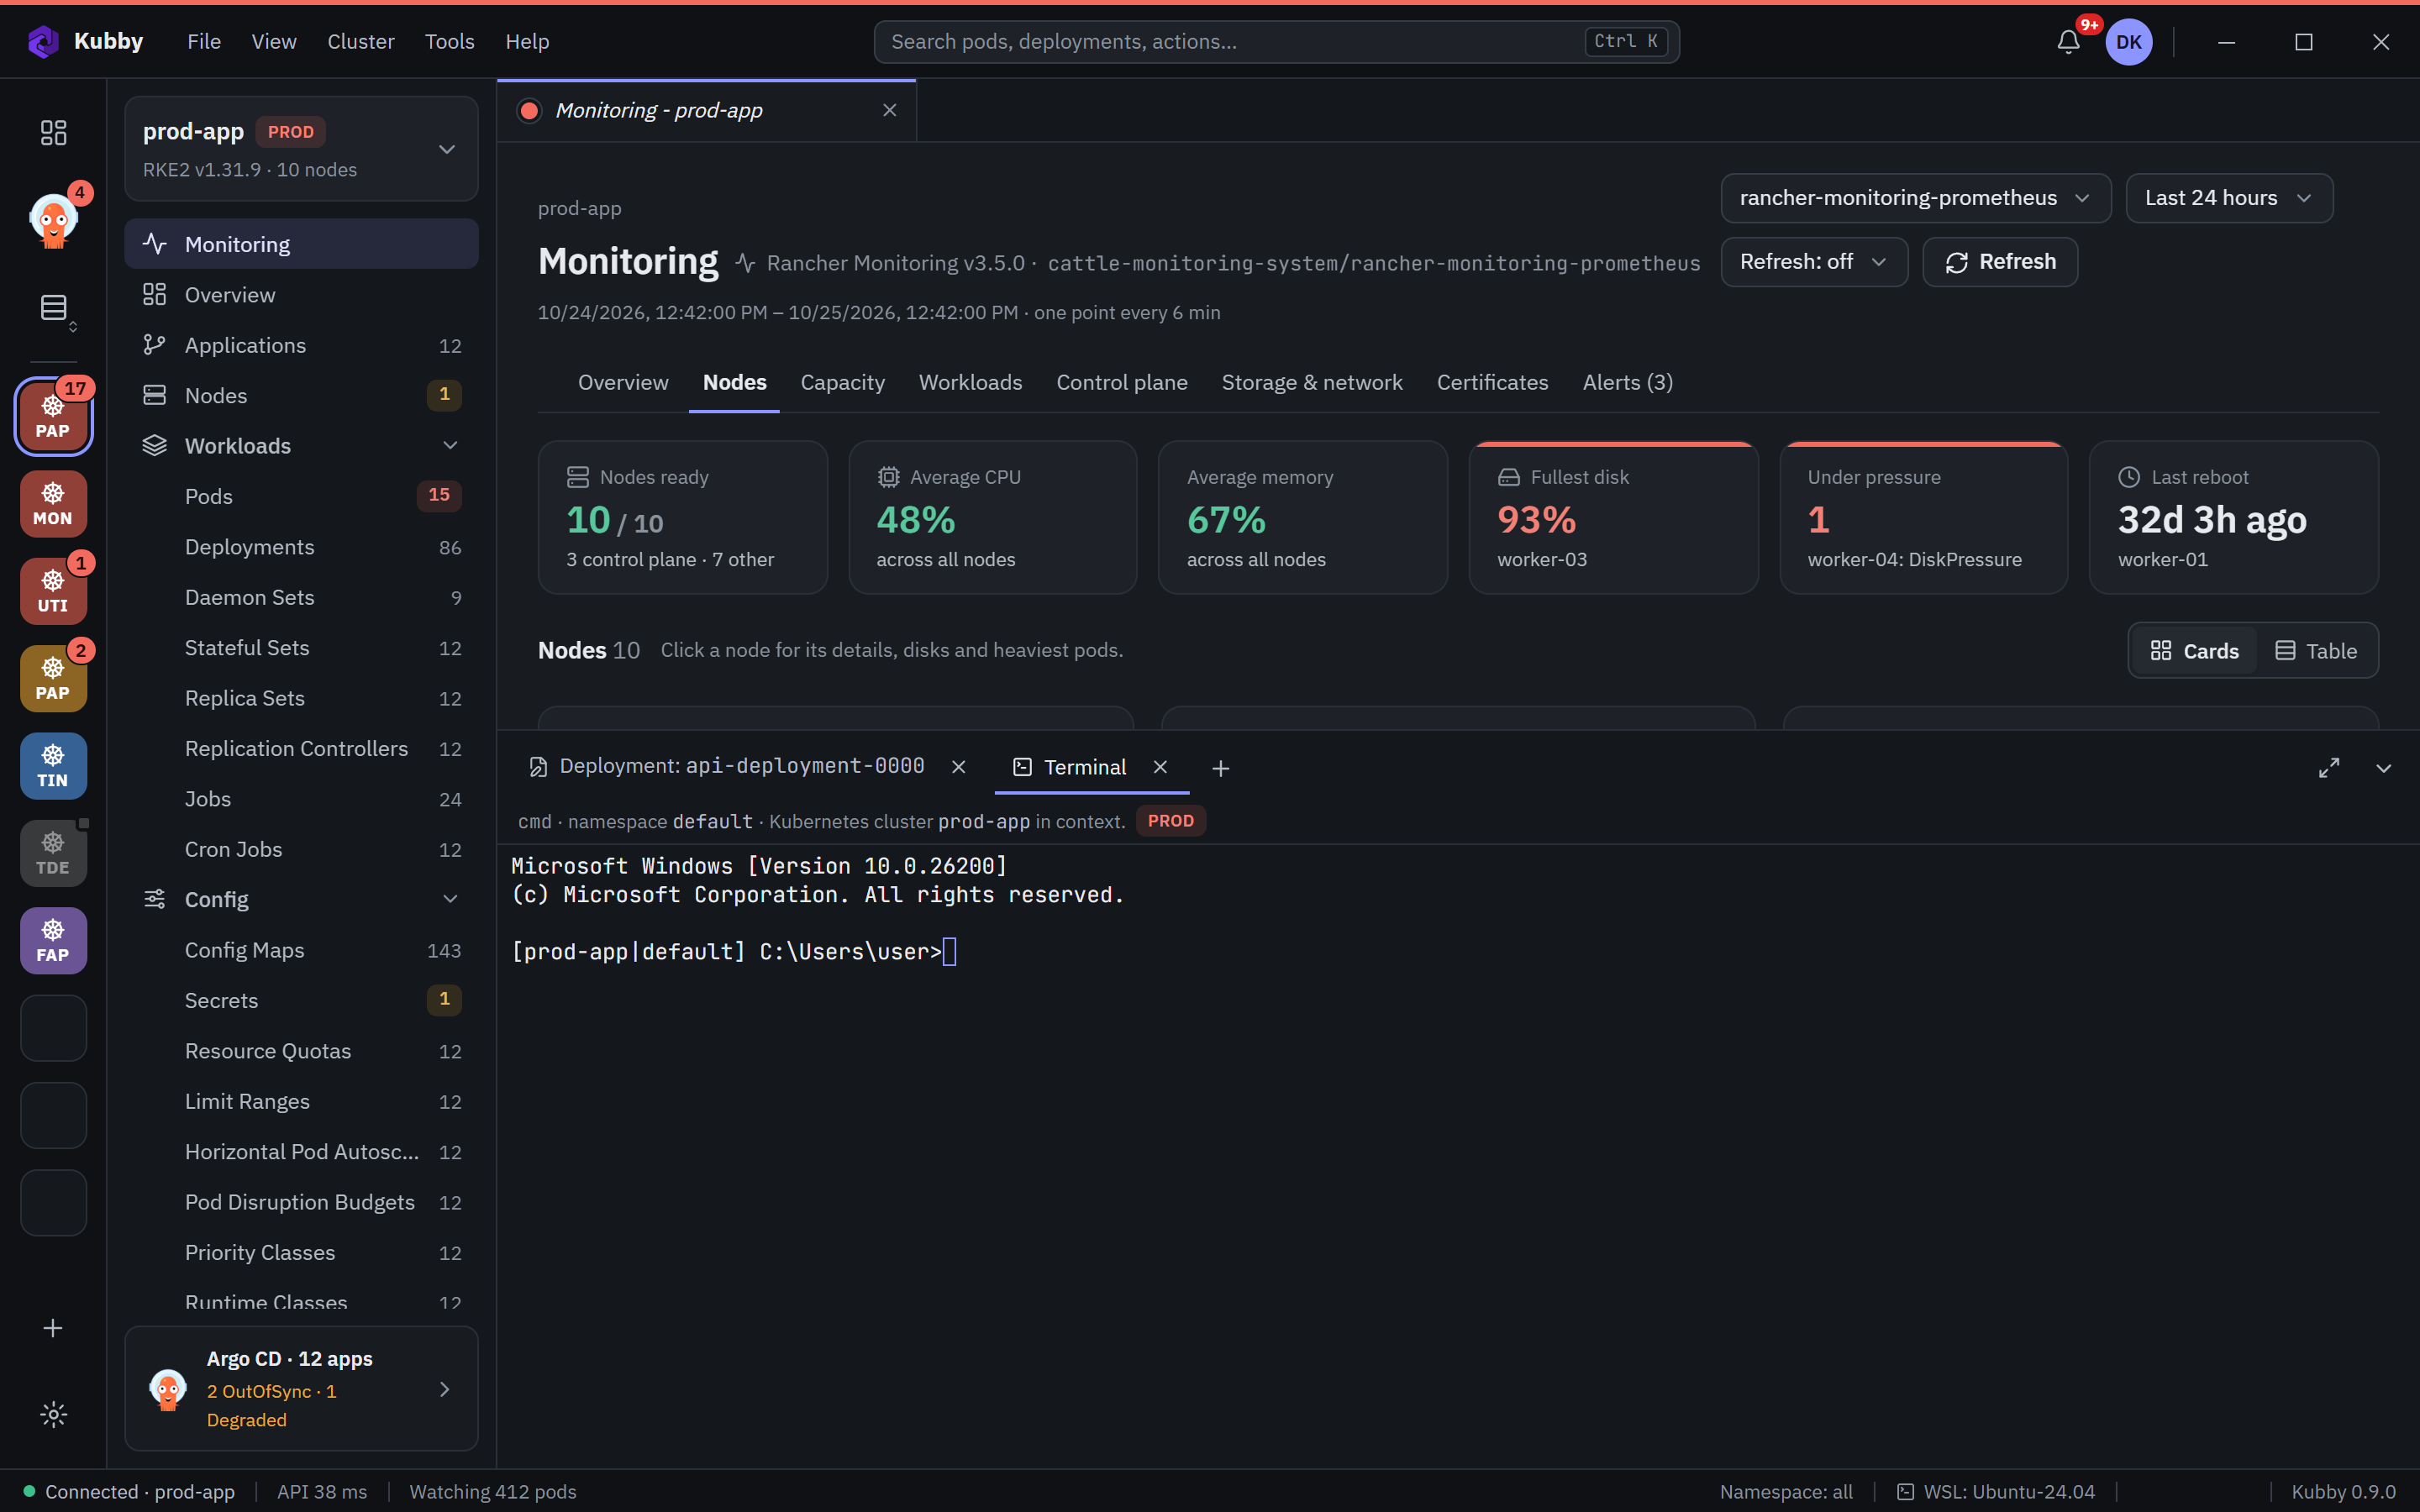
All your Argo CD instances in one place: health and sync charts, sync activity, the cluster map and projects.
Works with the Argo CD API, so the instance can run anywhere.
Learn more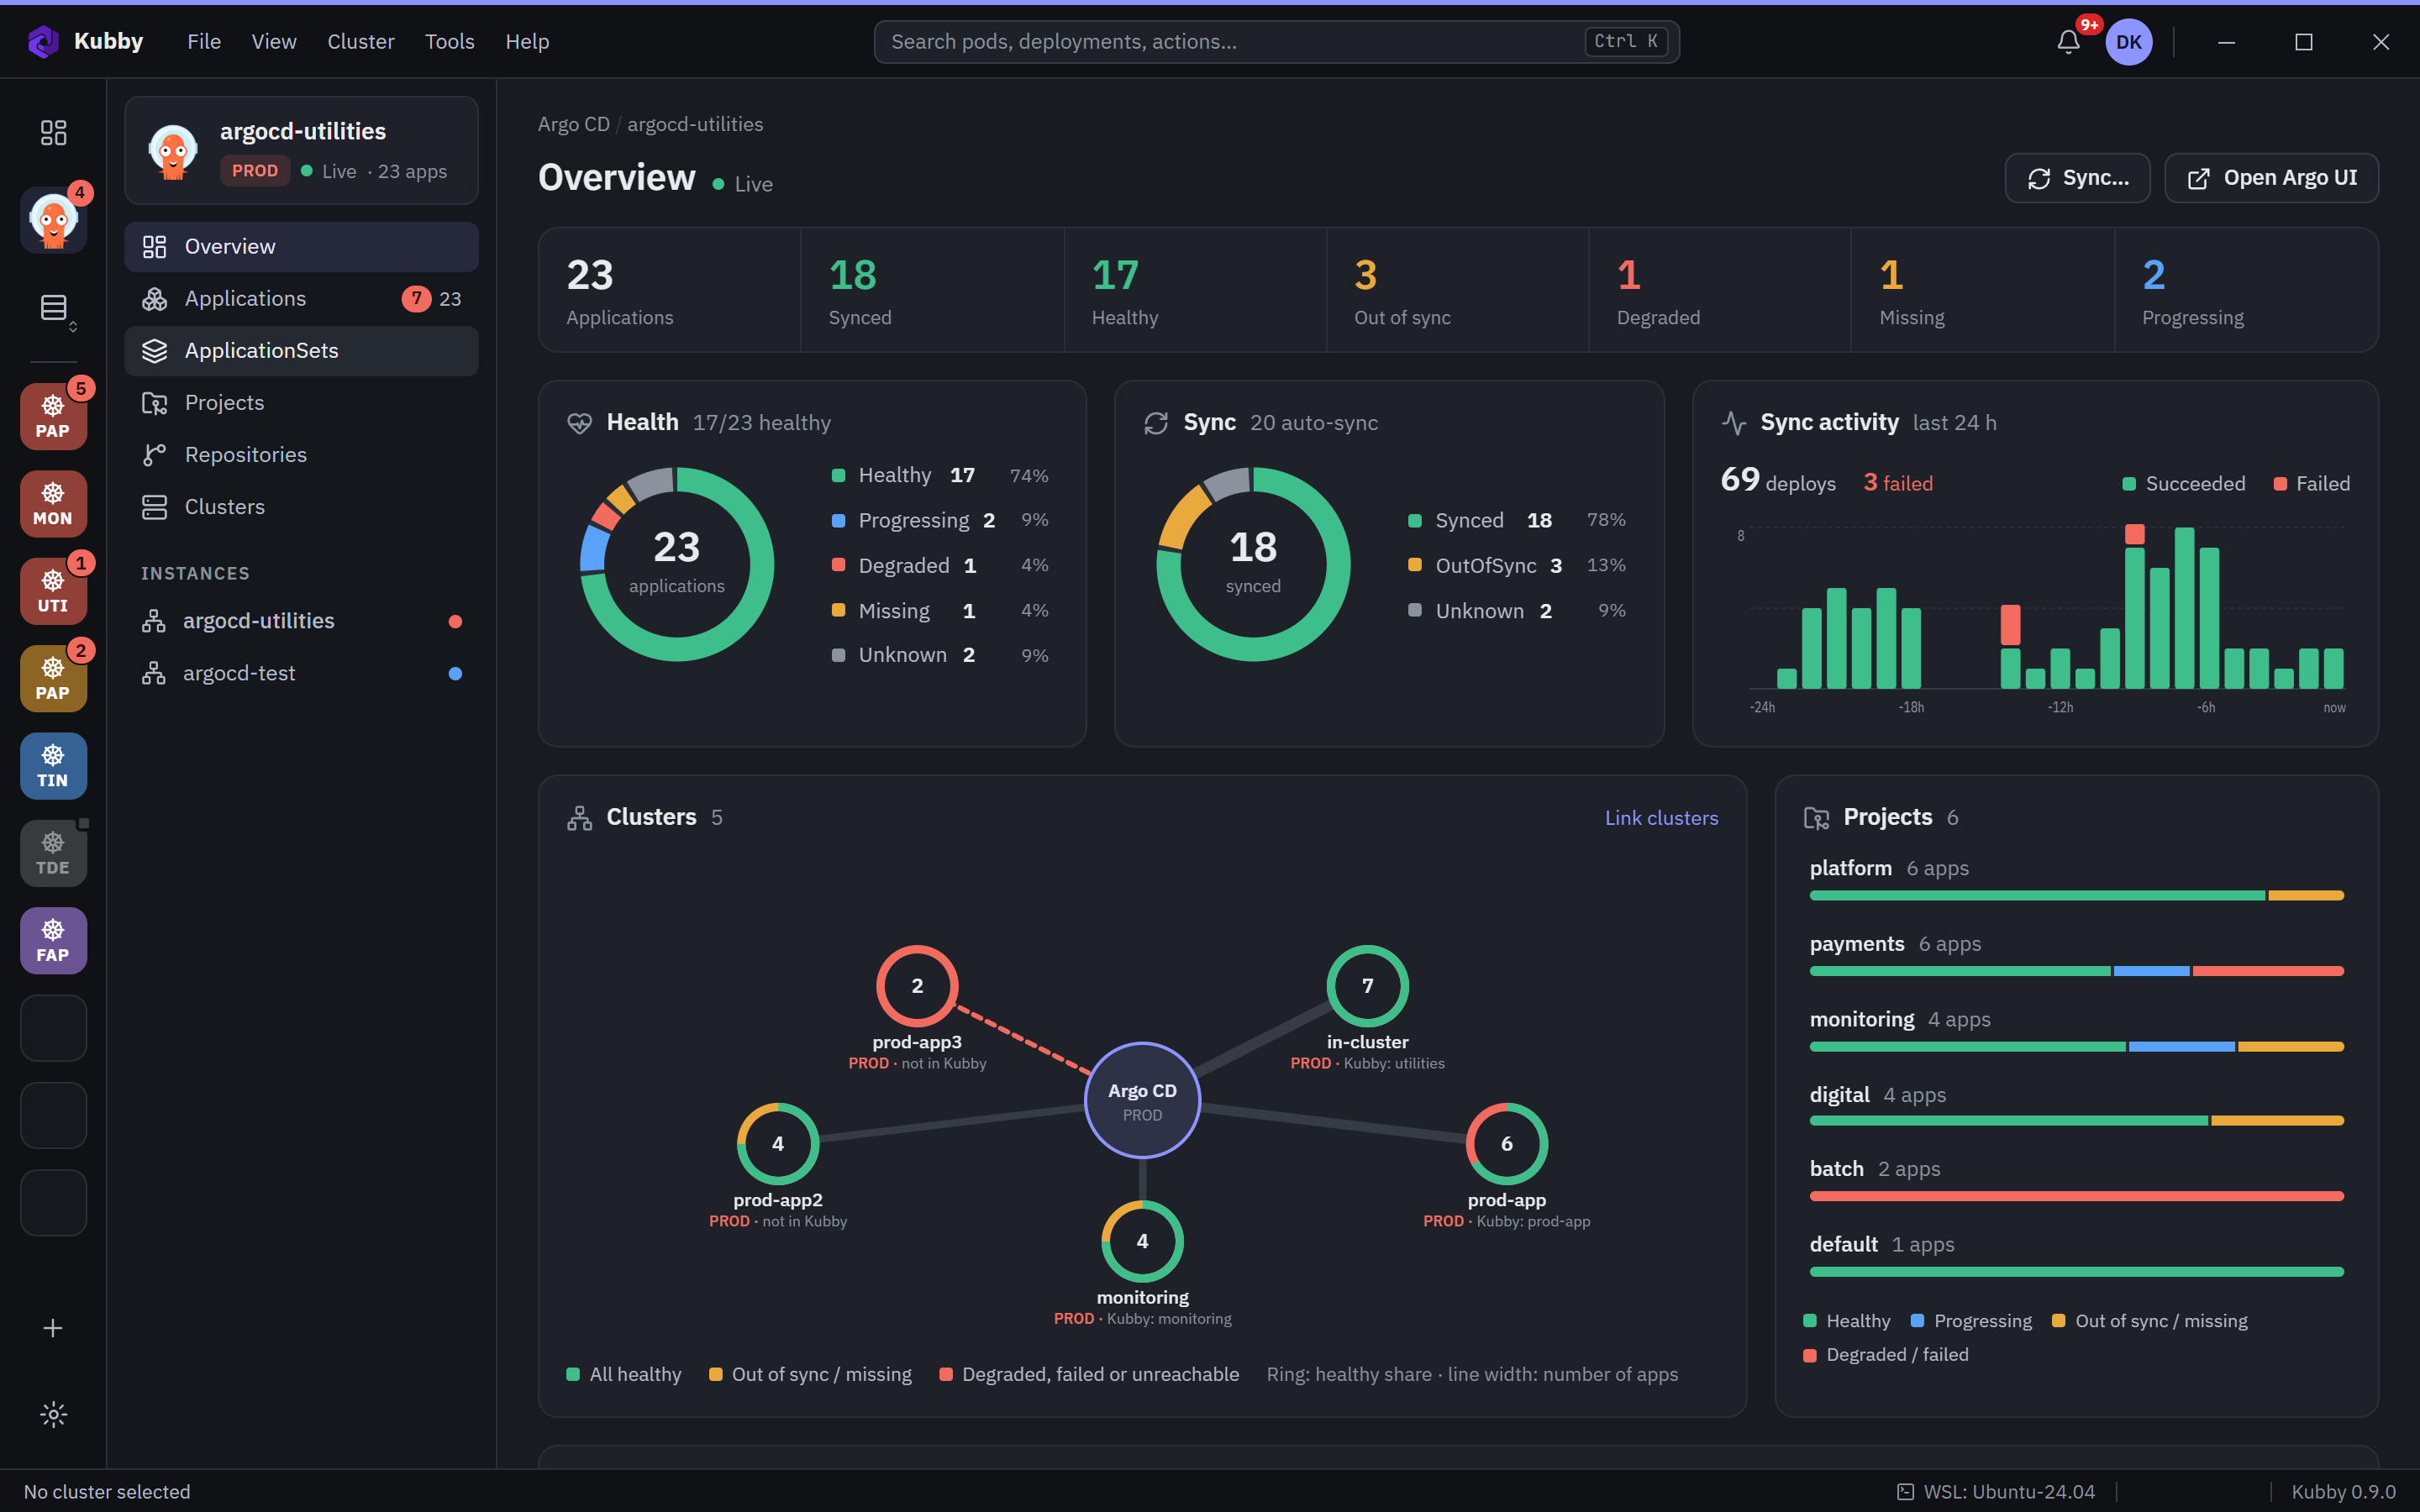
Applications with filters for what needs attention, and the reason behind a Degraded state.
Diff, history, rollback, sync and auto-sync from the same panel.
Learn more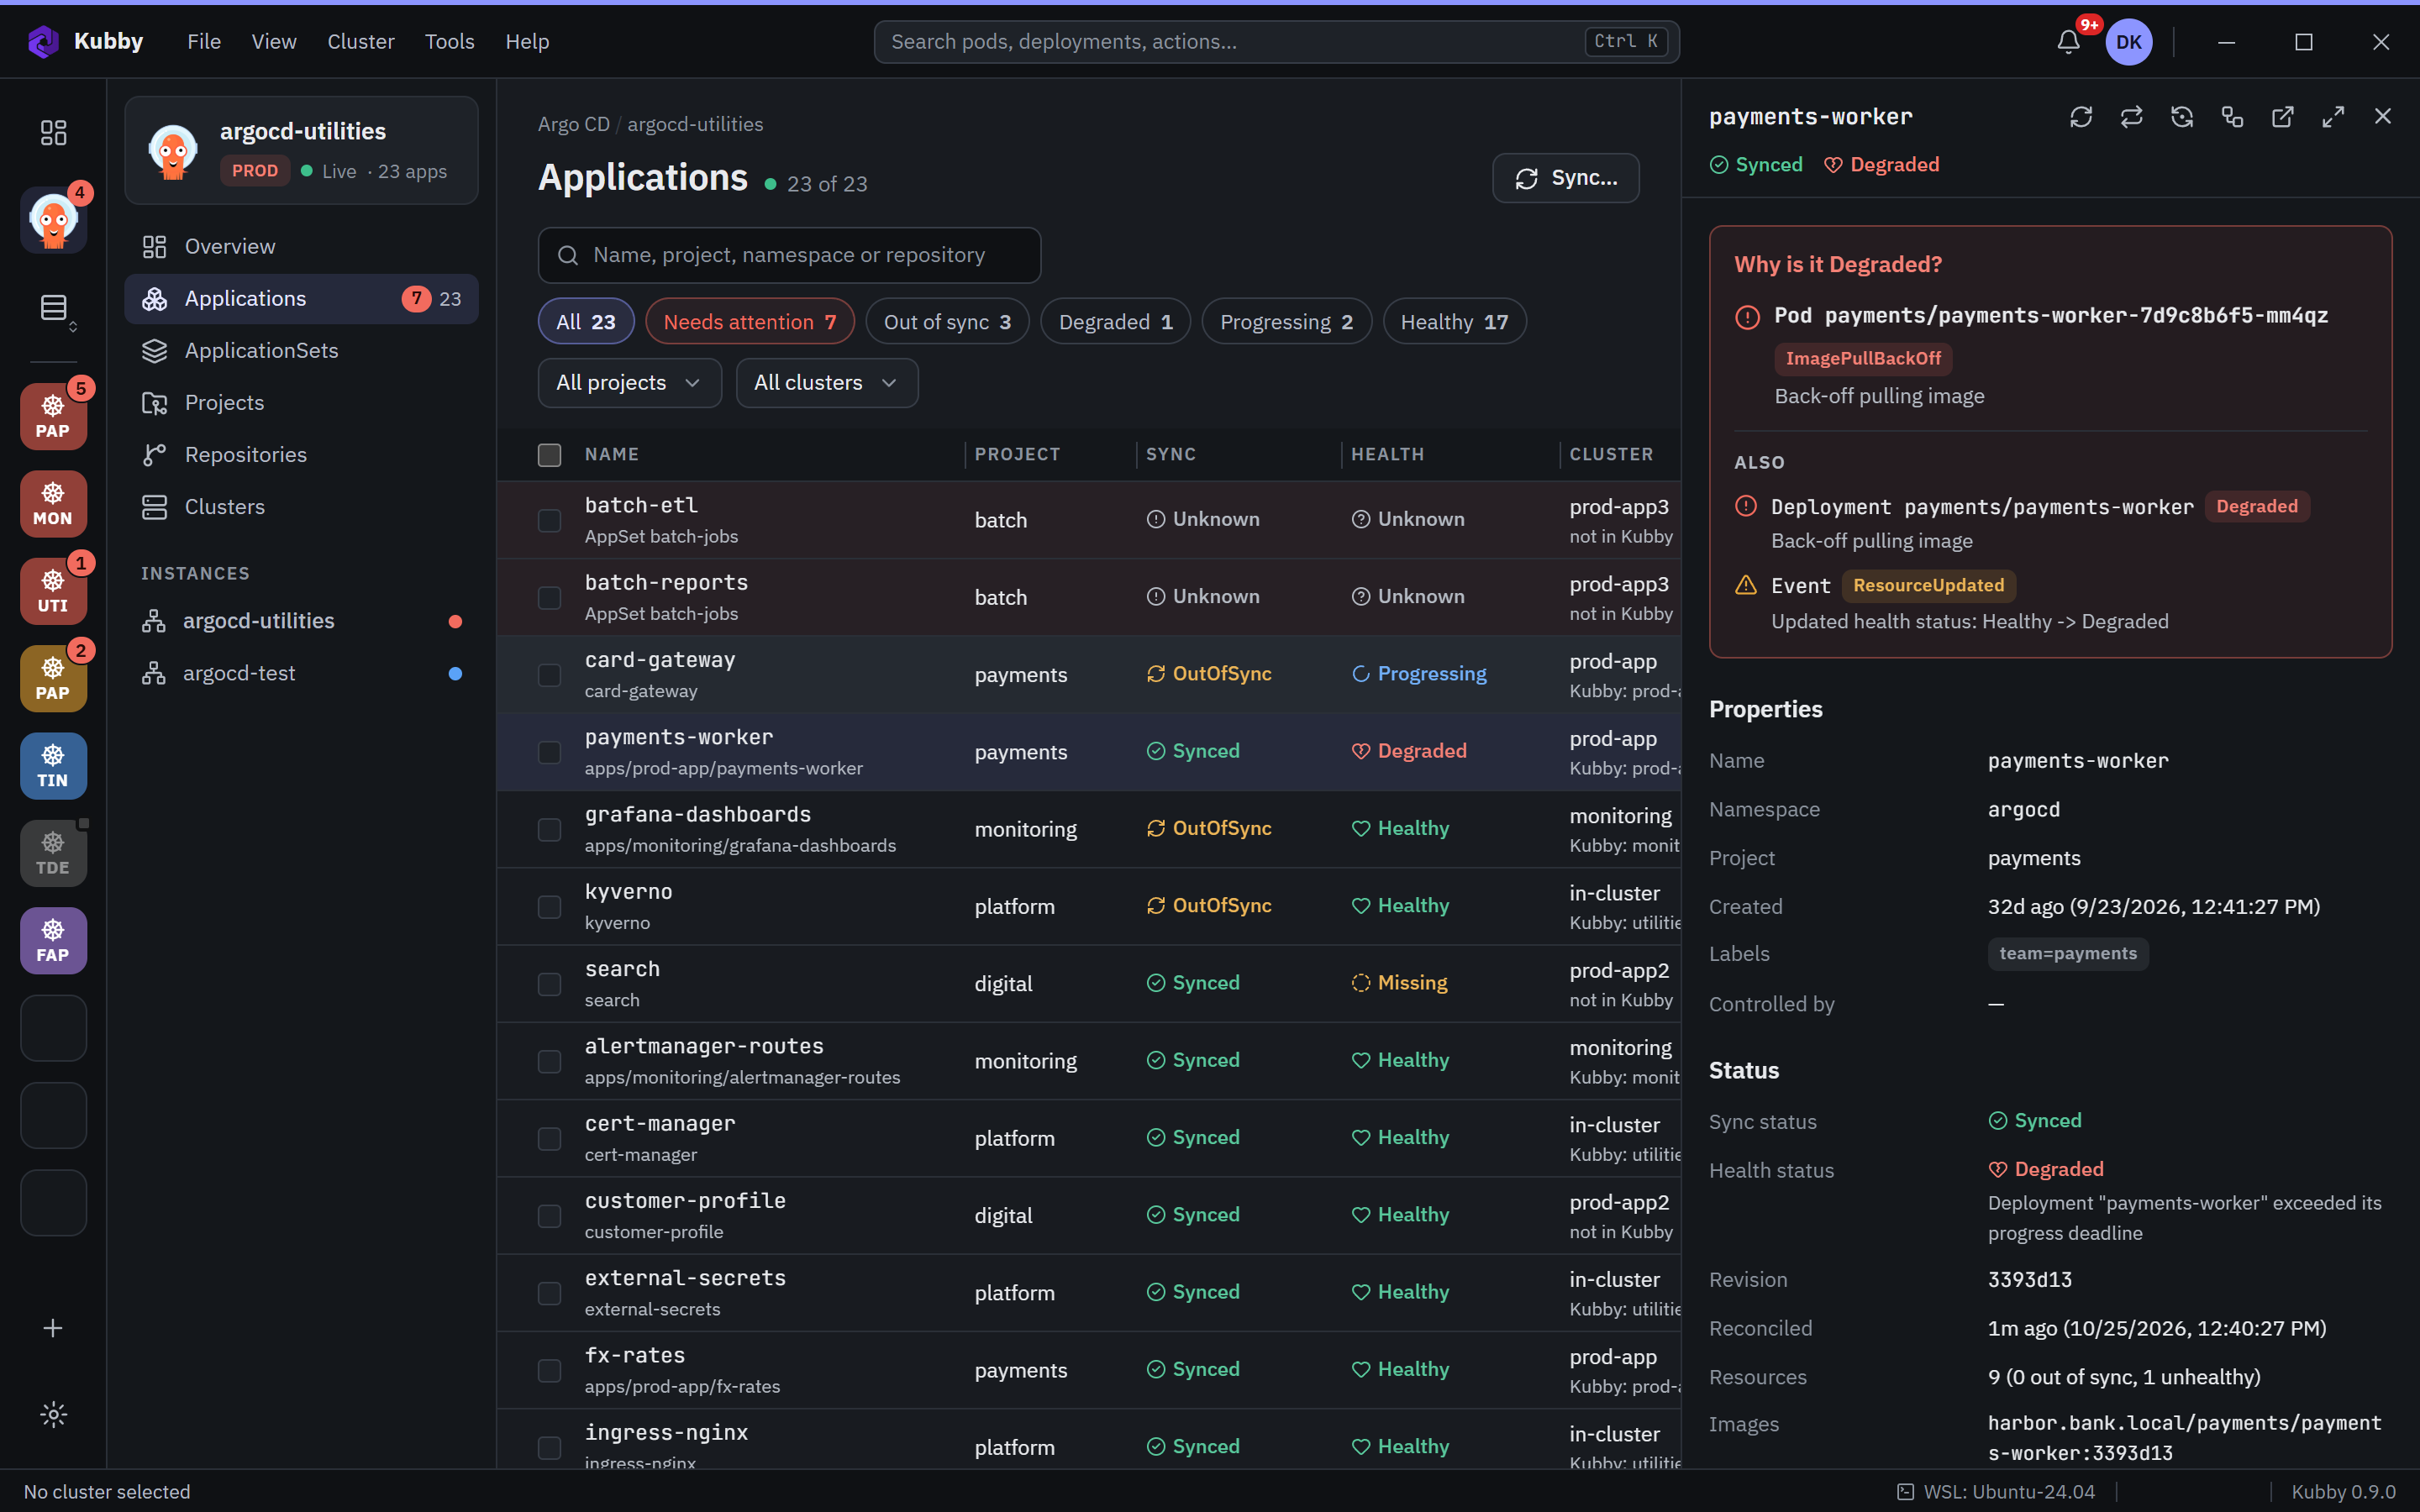
Releases across namespaces with chart and app versions, a newer-version badge and status.
Values, upgrade to another version, revision compare and rollback.
Learn more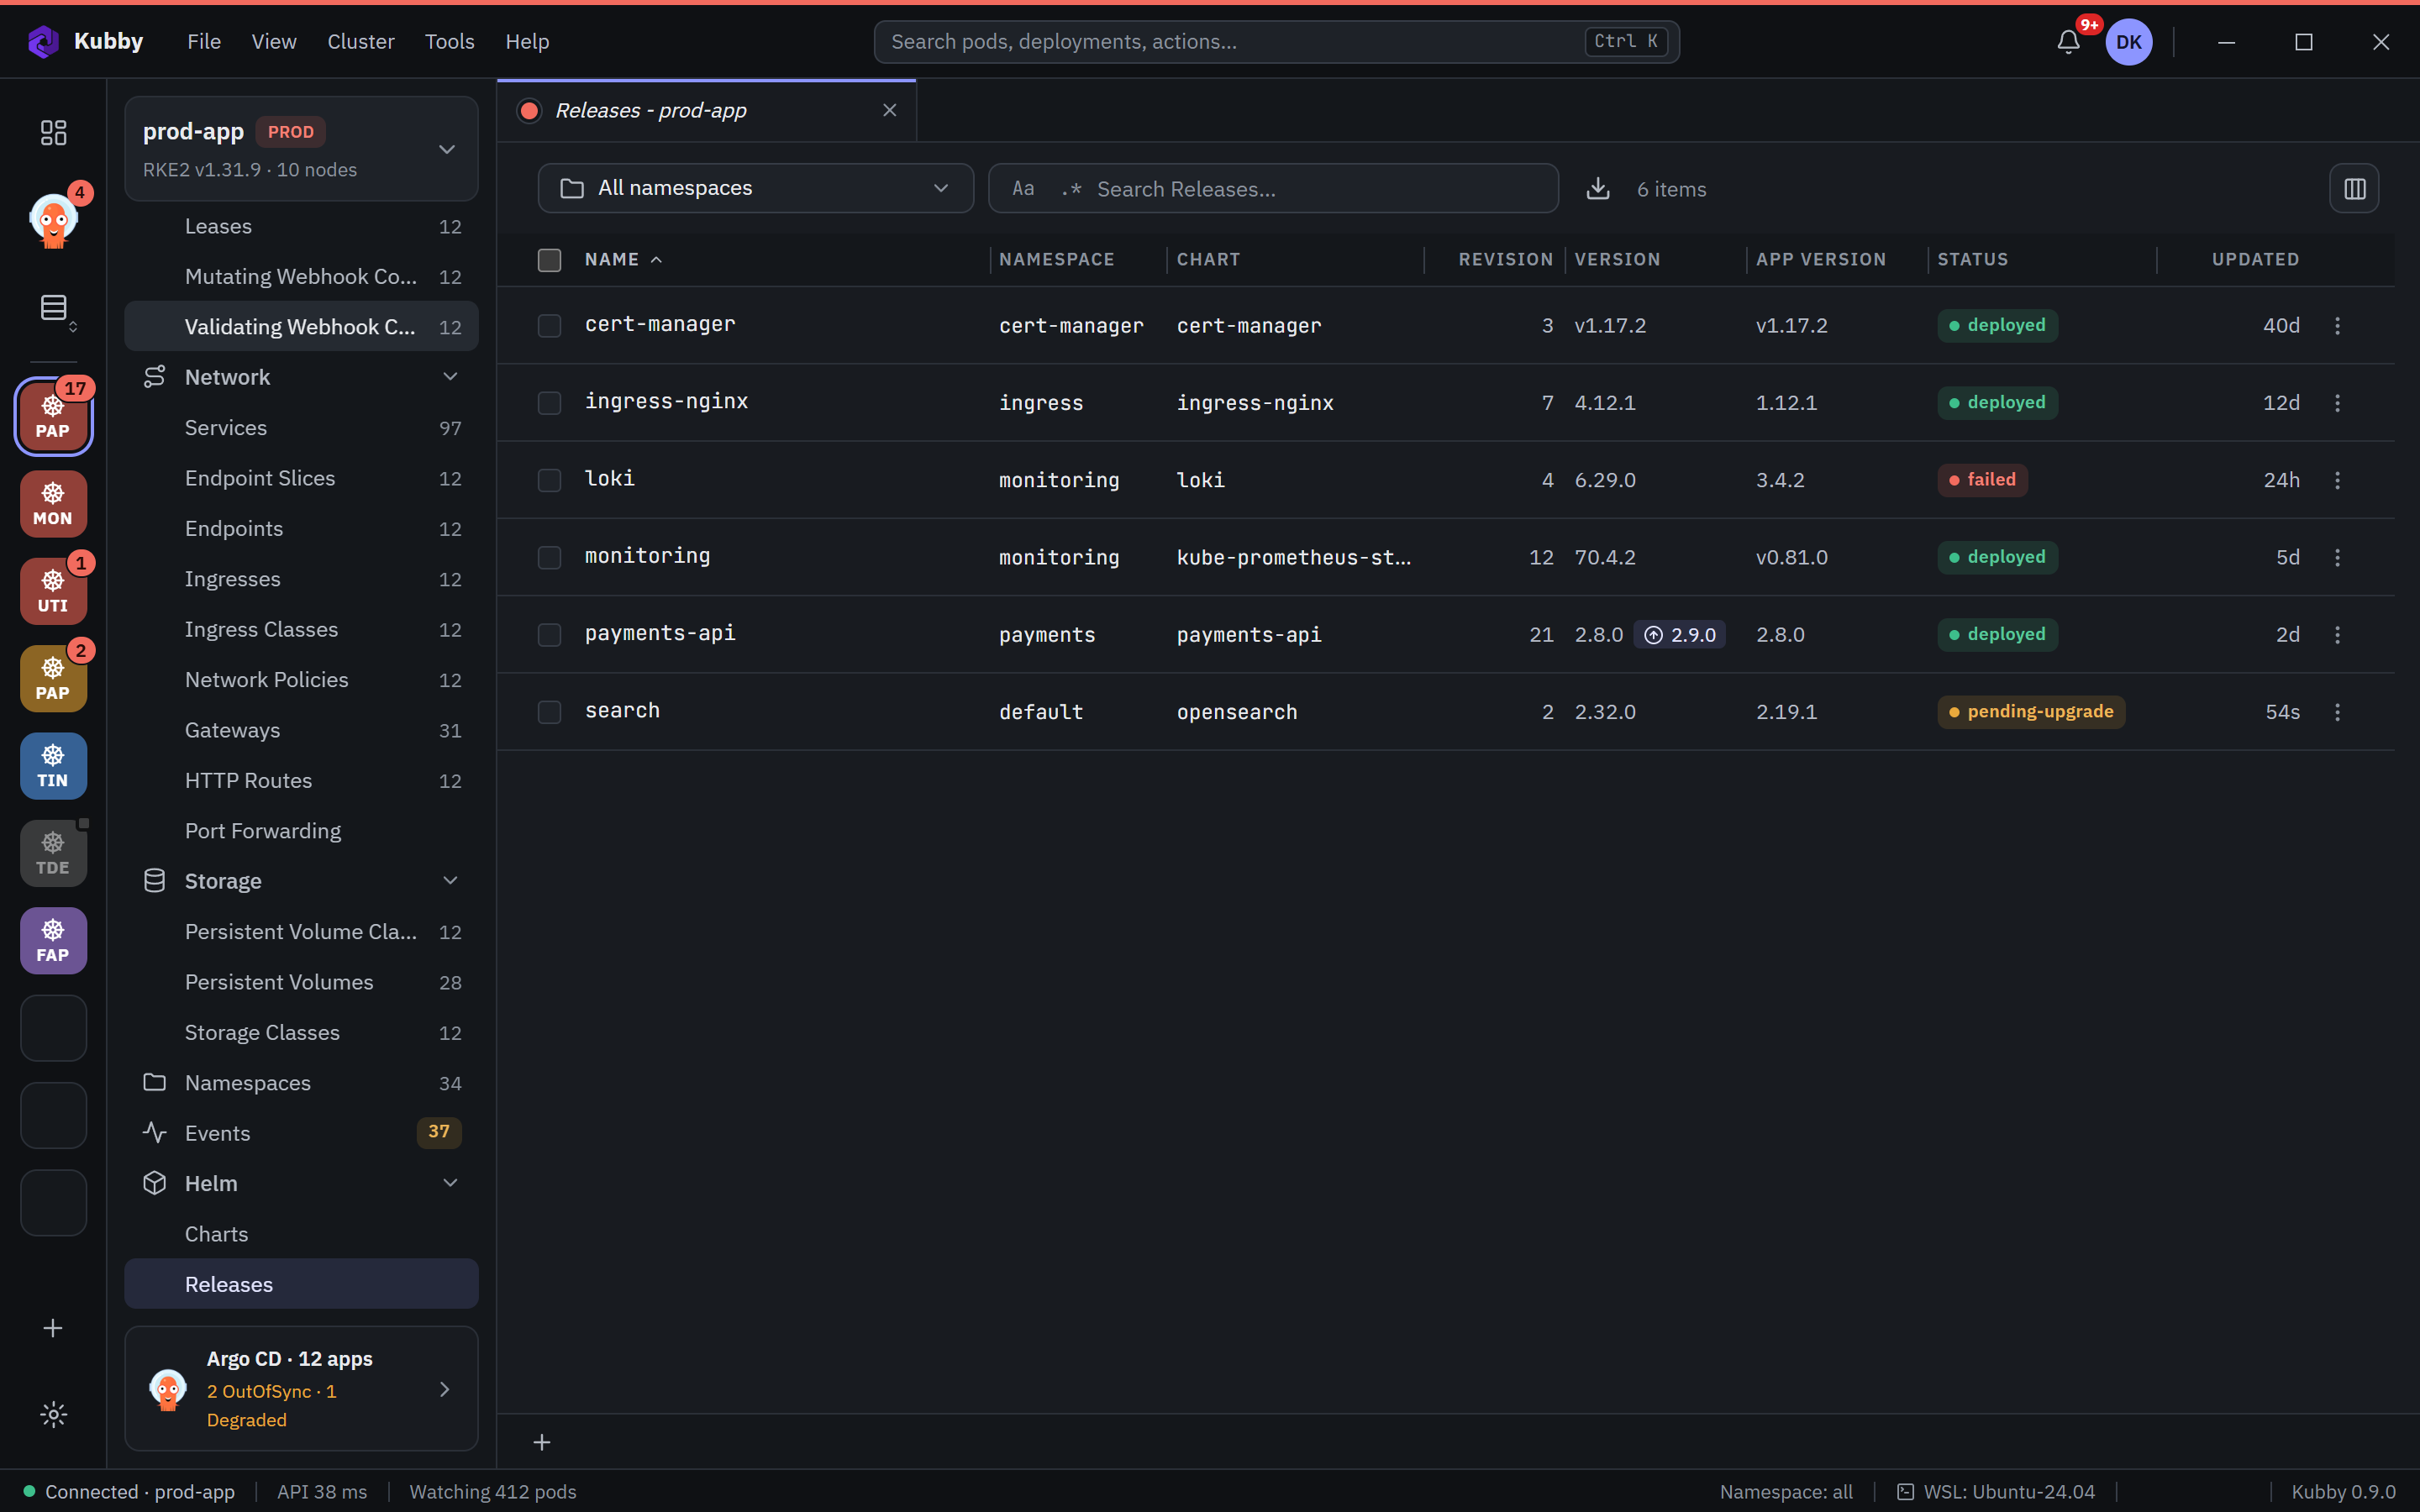
Every revision of a Deployment with its image and age.
Roll back to a revision in one click, after a confirmation.
Learn more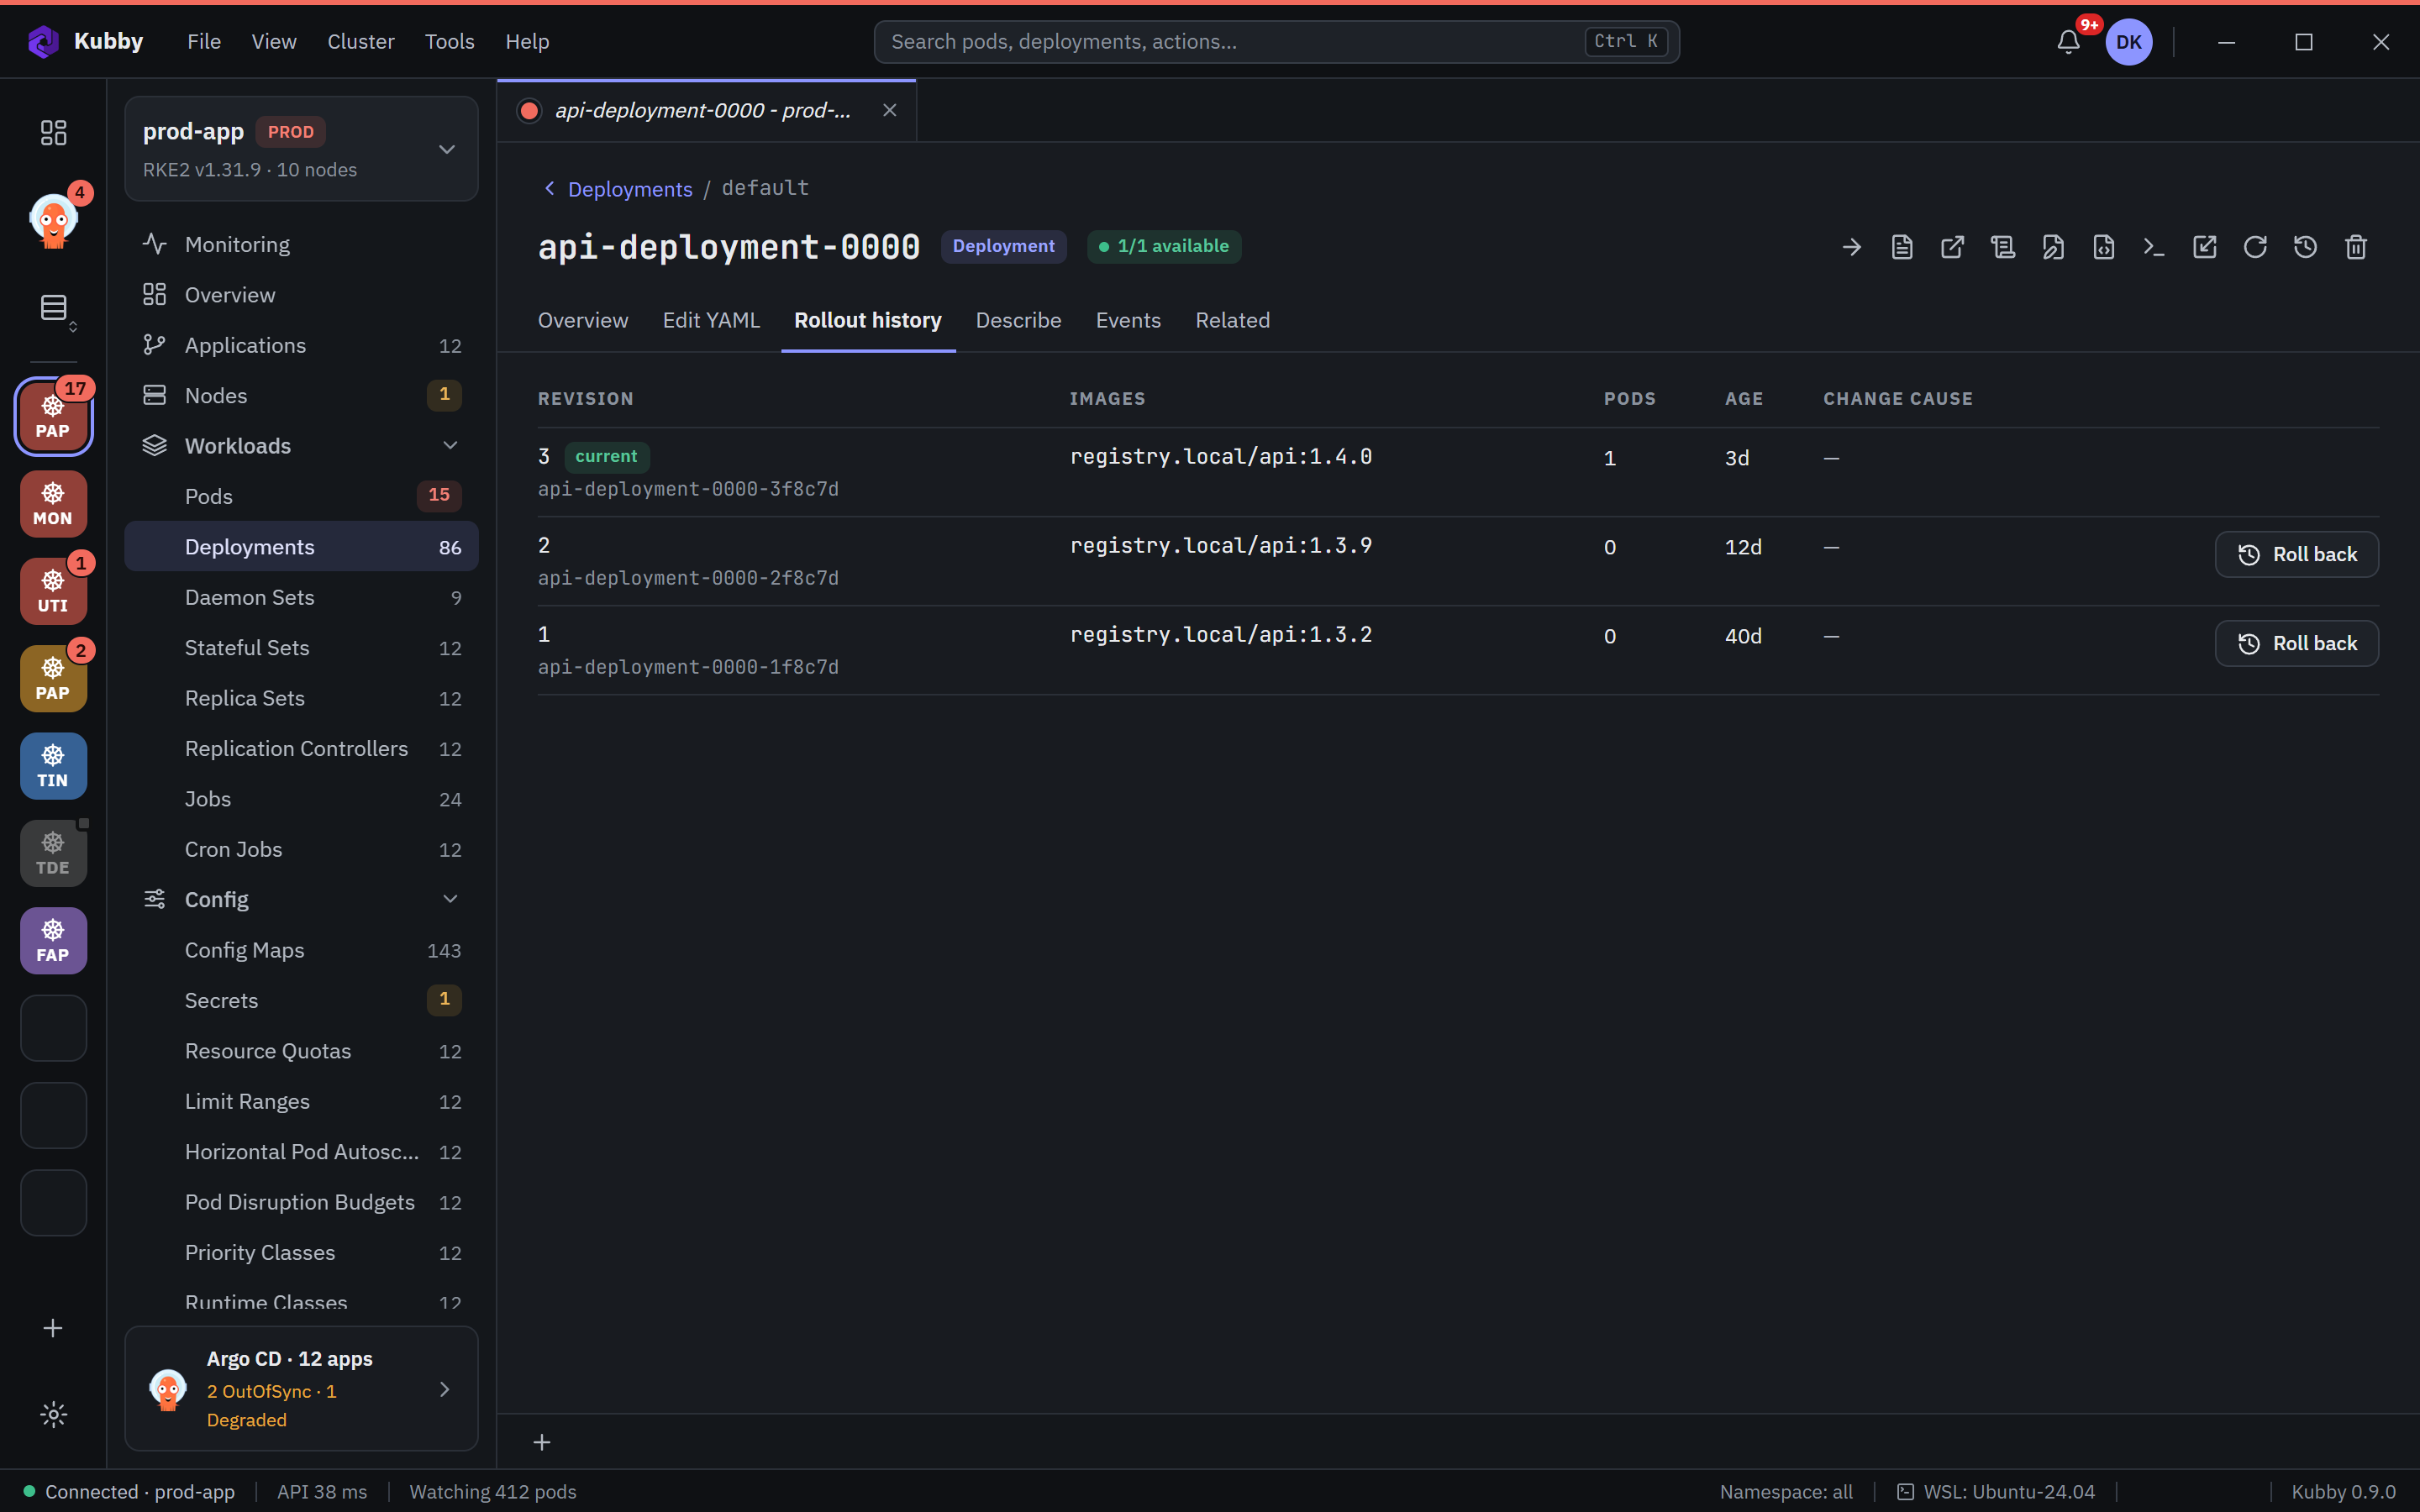
Ctrl+K reaches every resource, page and action, in this cluster or the others.
Keyboard shortcuts on every screen.
Learn more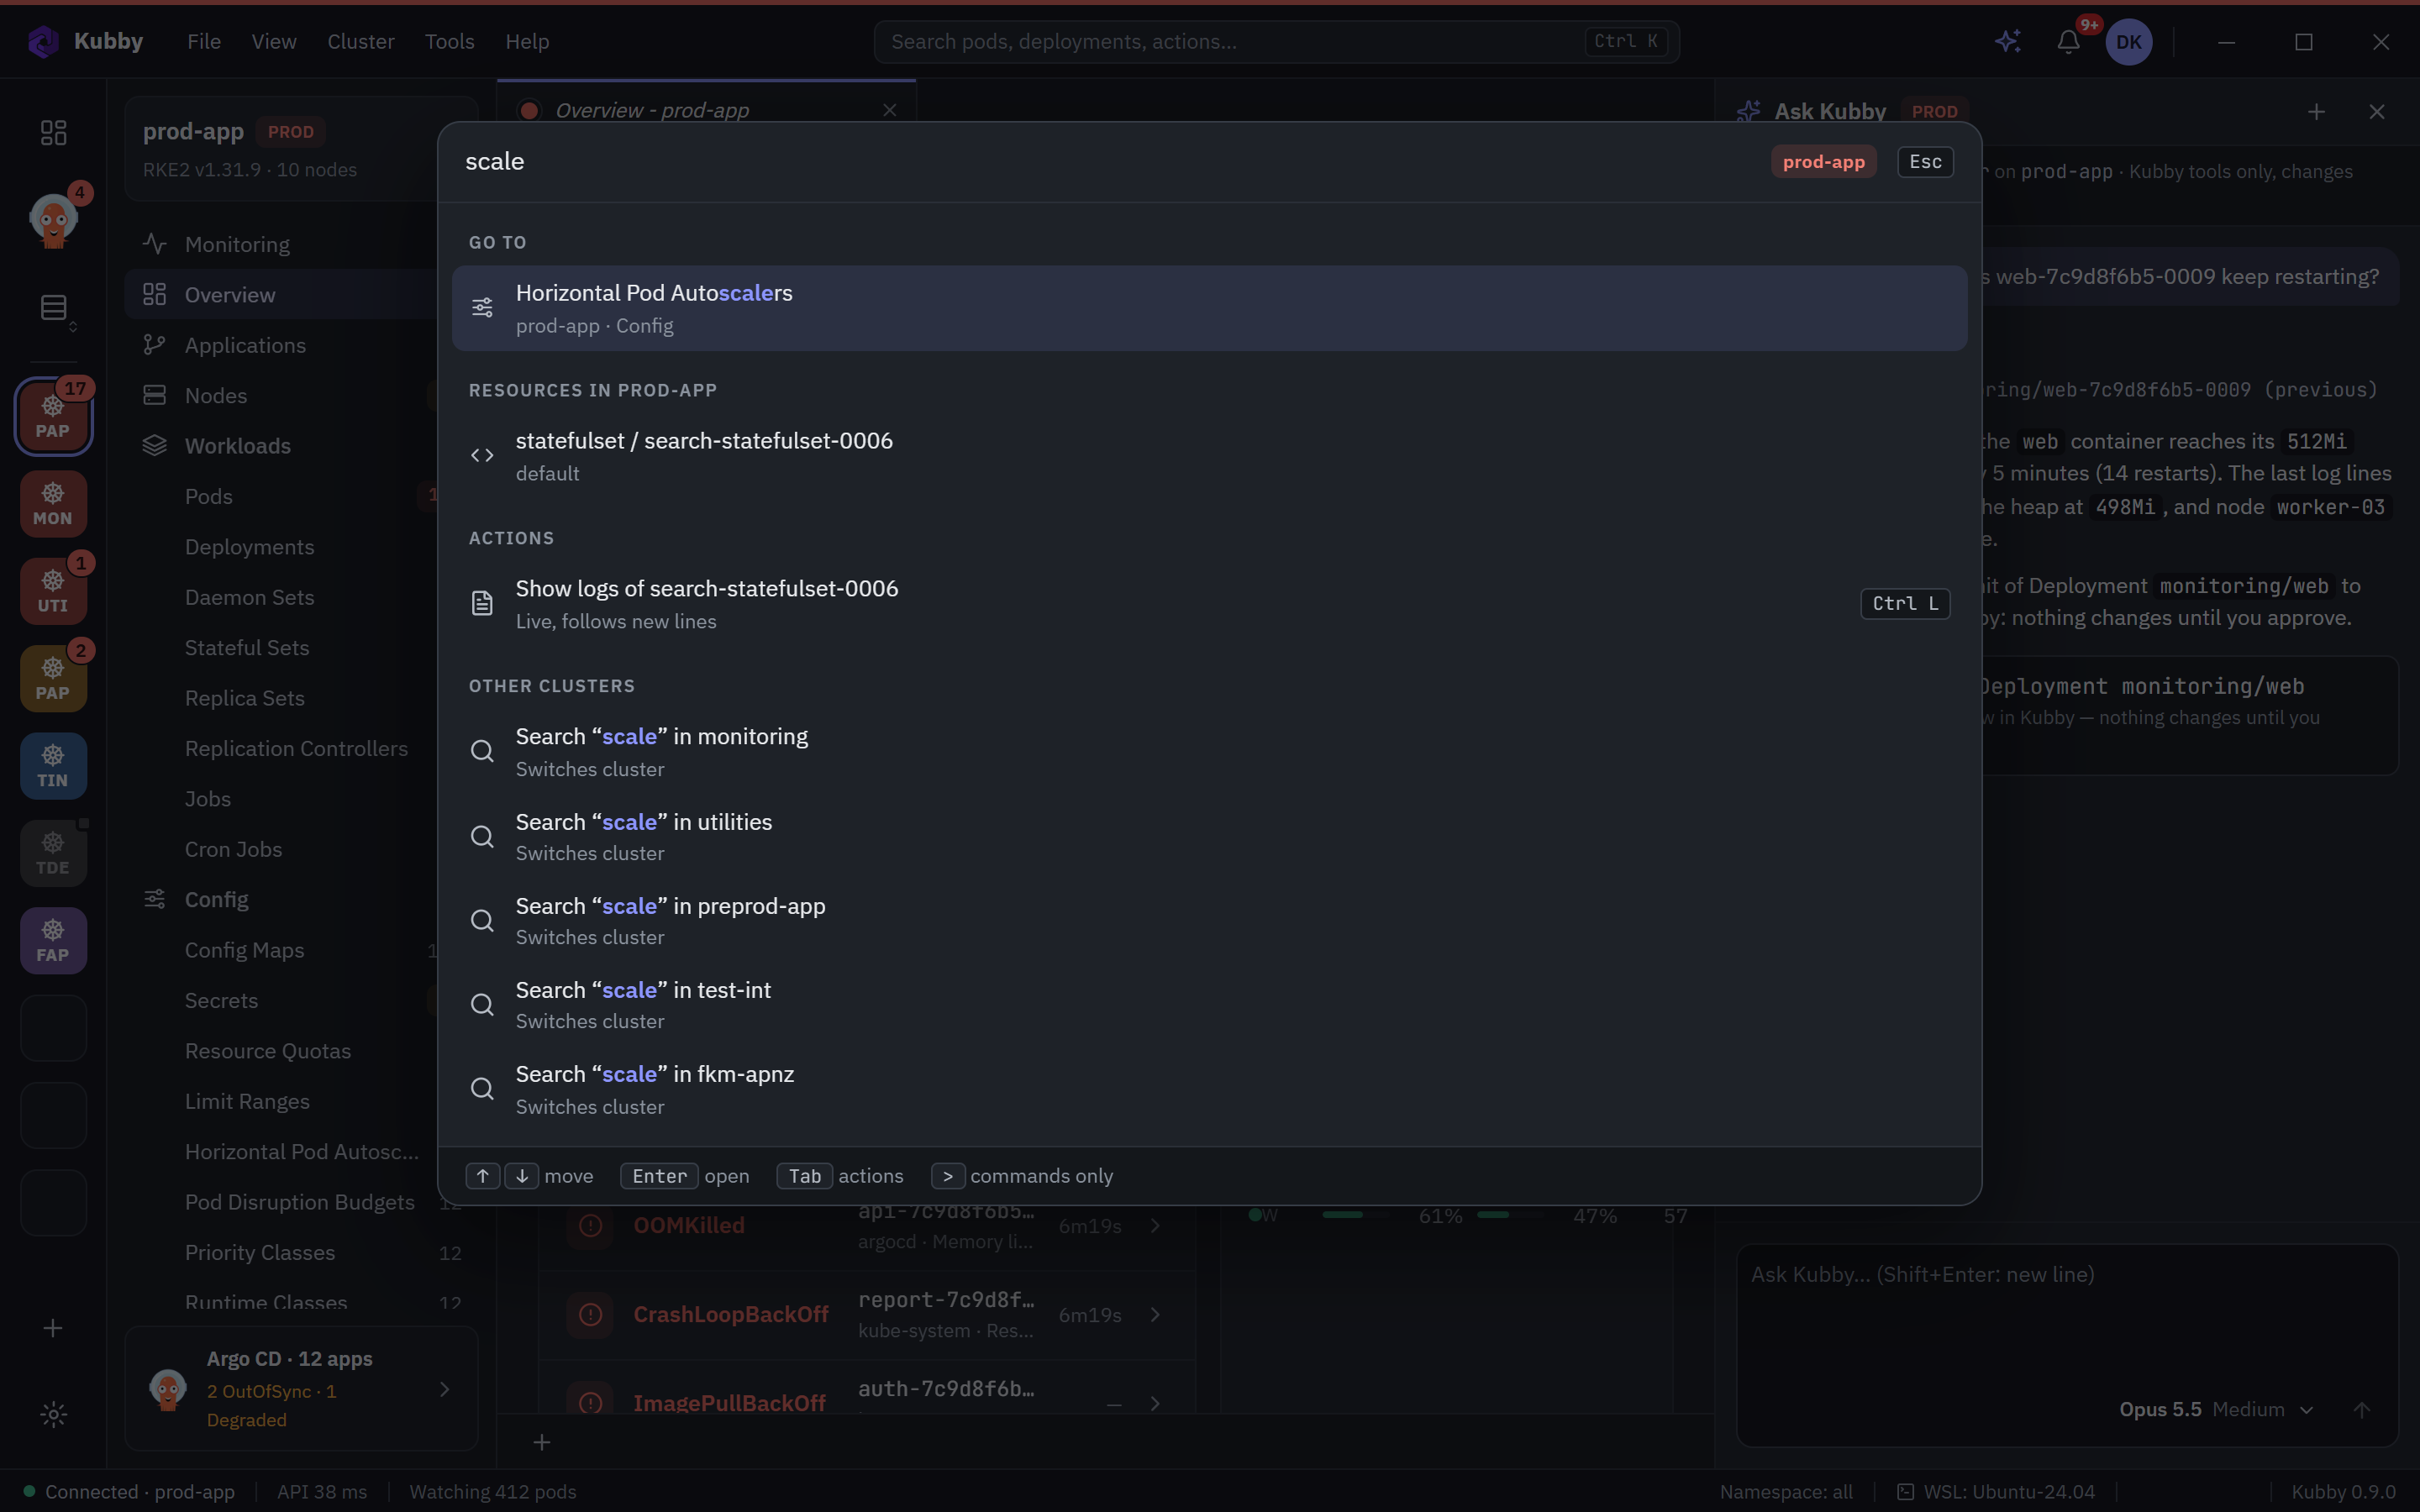
PowerShell, cmd or WSL with the cluster's kubeconfig loaded and the namespace set.
Pod shells and port forwarding from the same place.
Learn more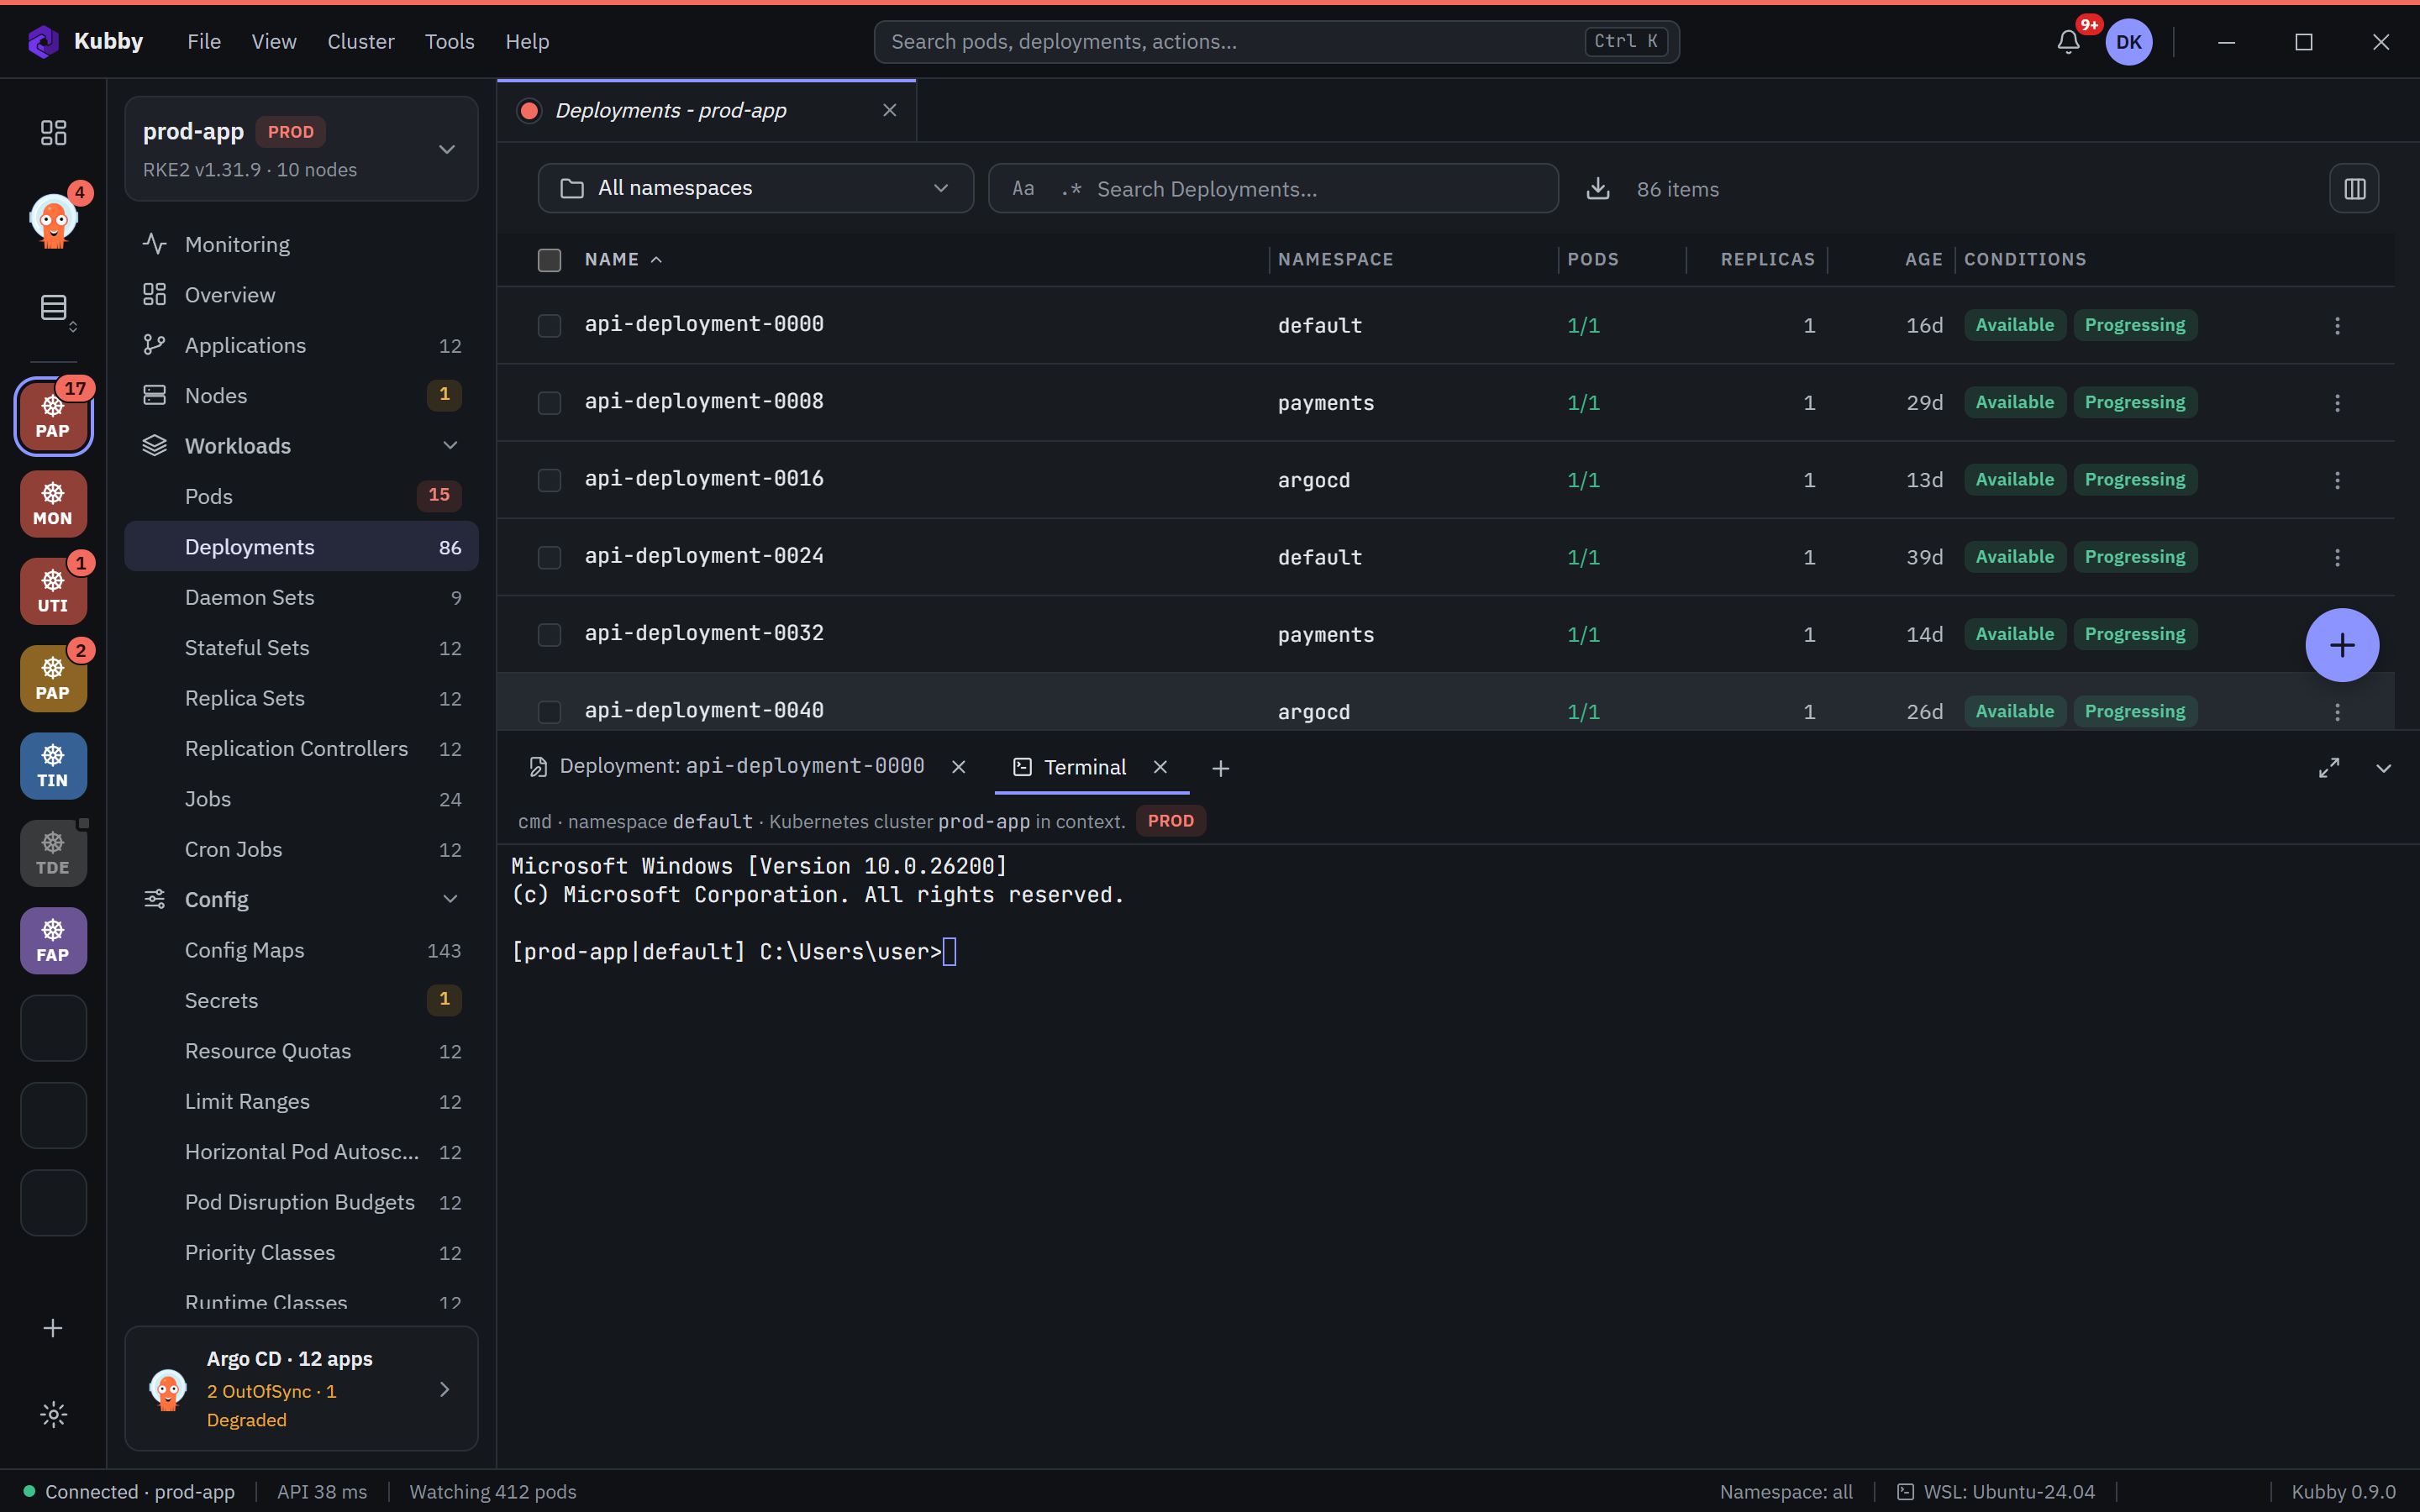
Security patches and new versions matched to the components in your cluster: ingress-nginx, RKE2, Kubernetes, Argo CD.
Prometheus alerts in the same bell.
Learn more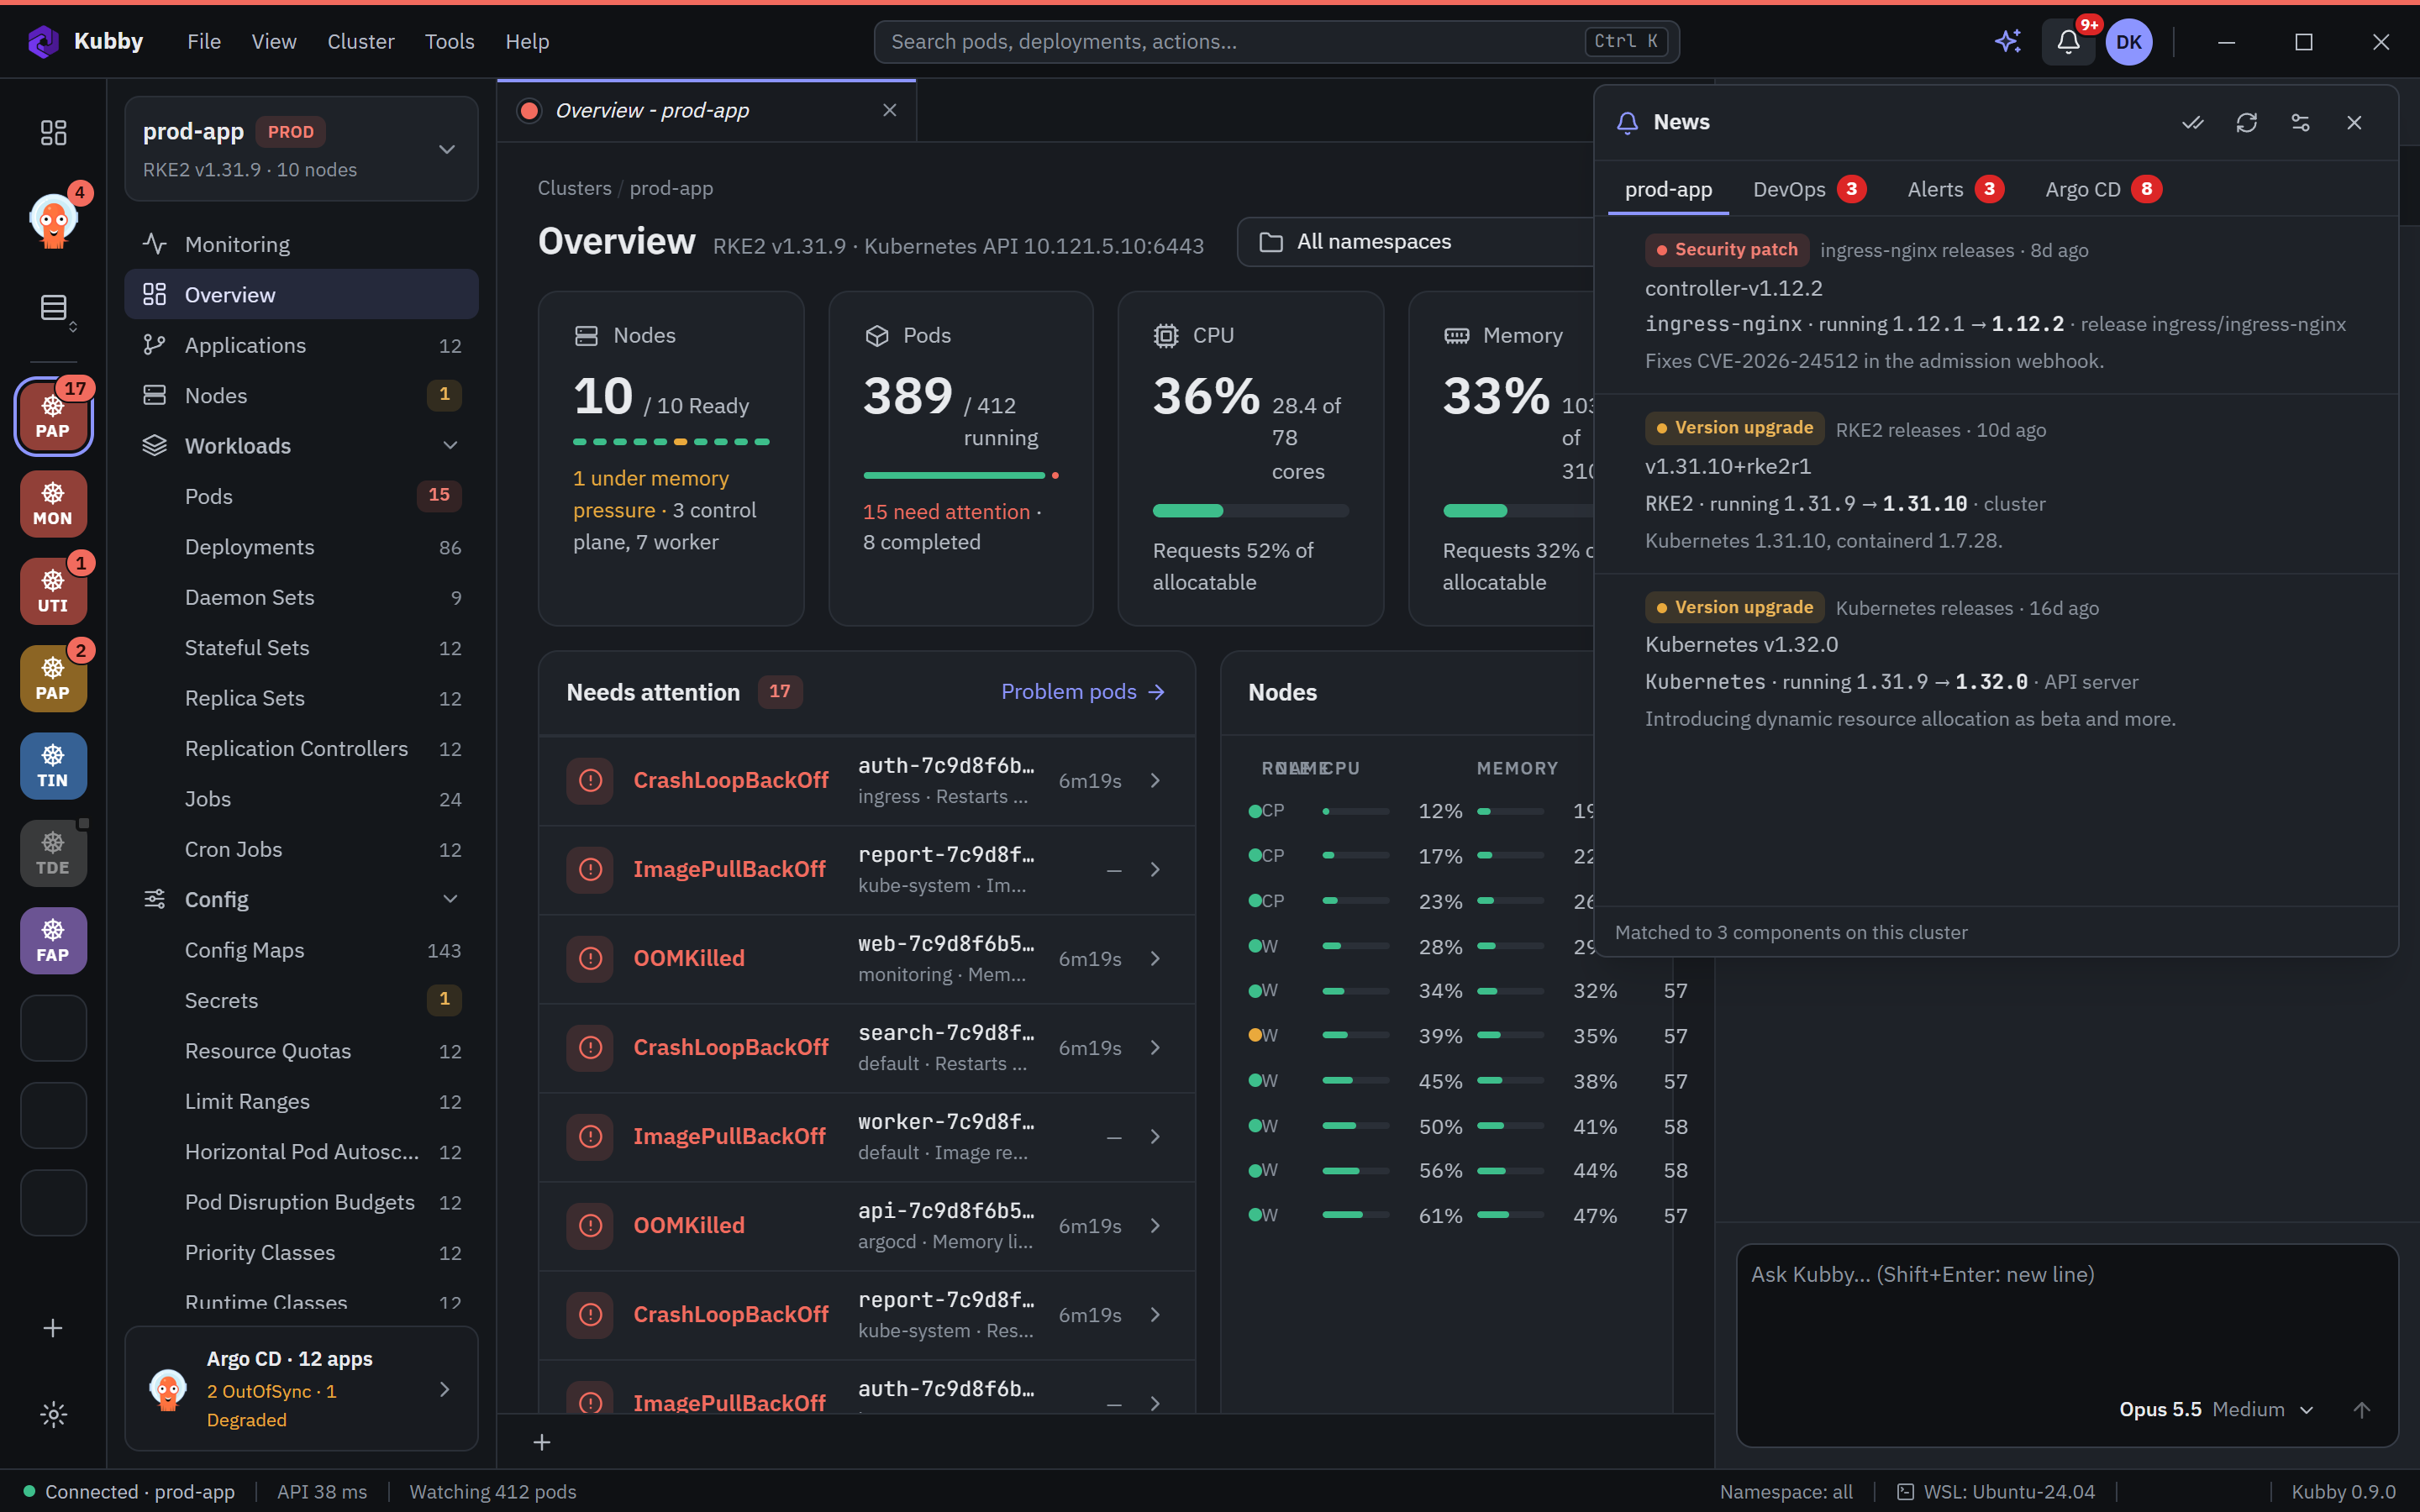
Every apply, scale, restart, cordon, delete and secret reveal with the user, cluster, object and result.
Filter by user, action or object.
Learn more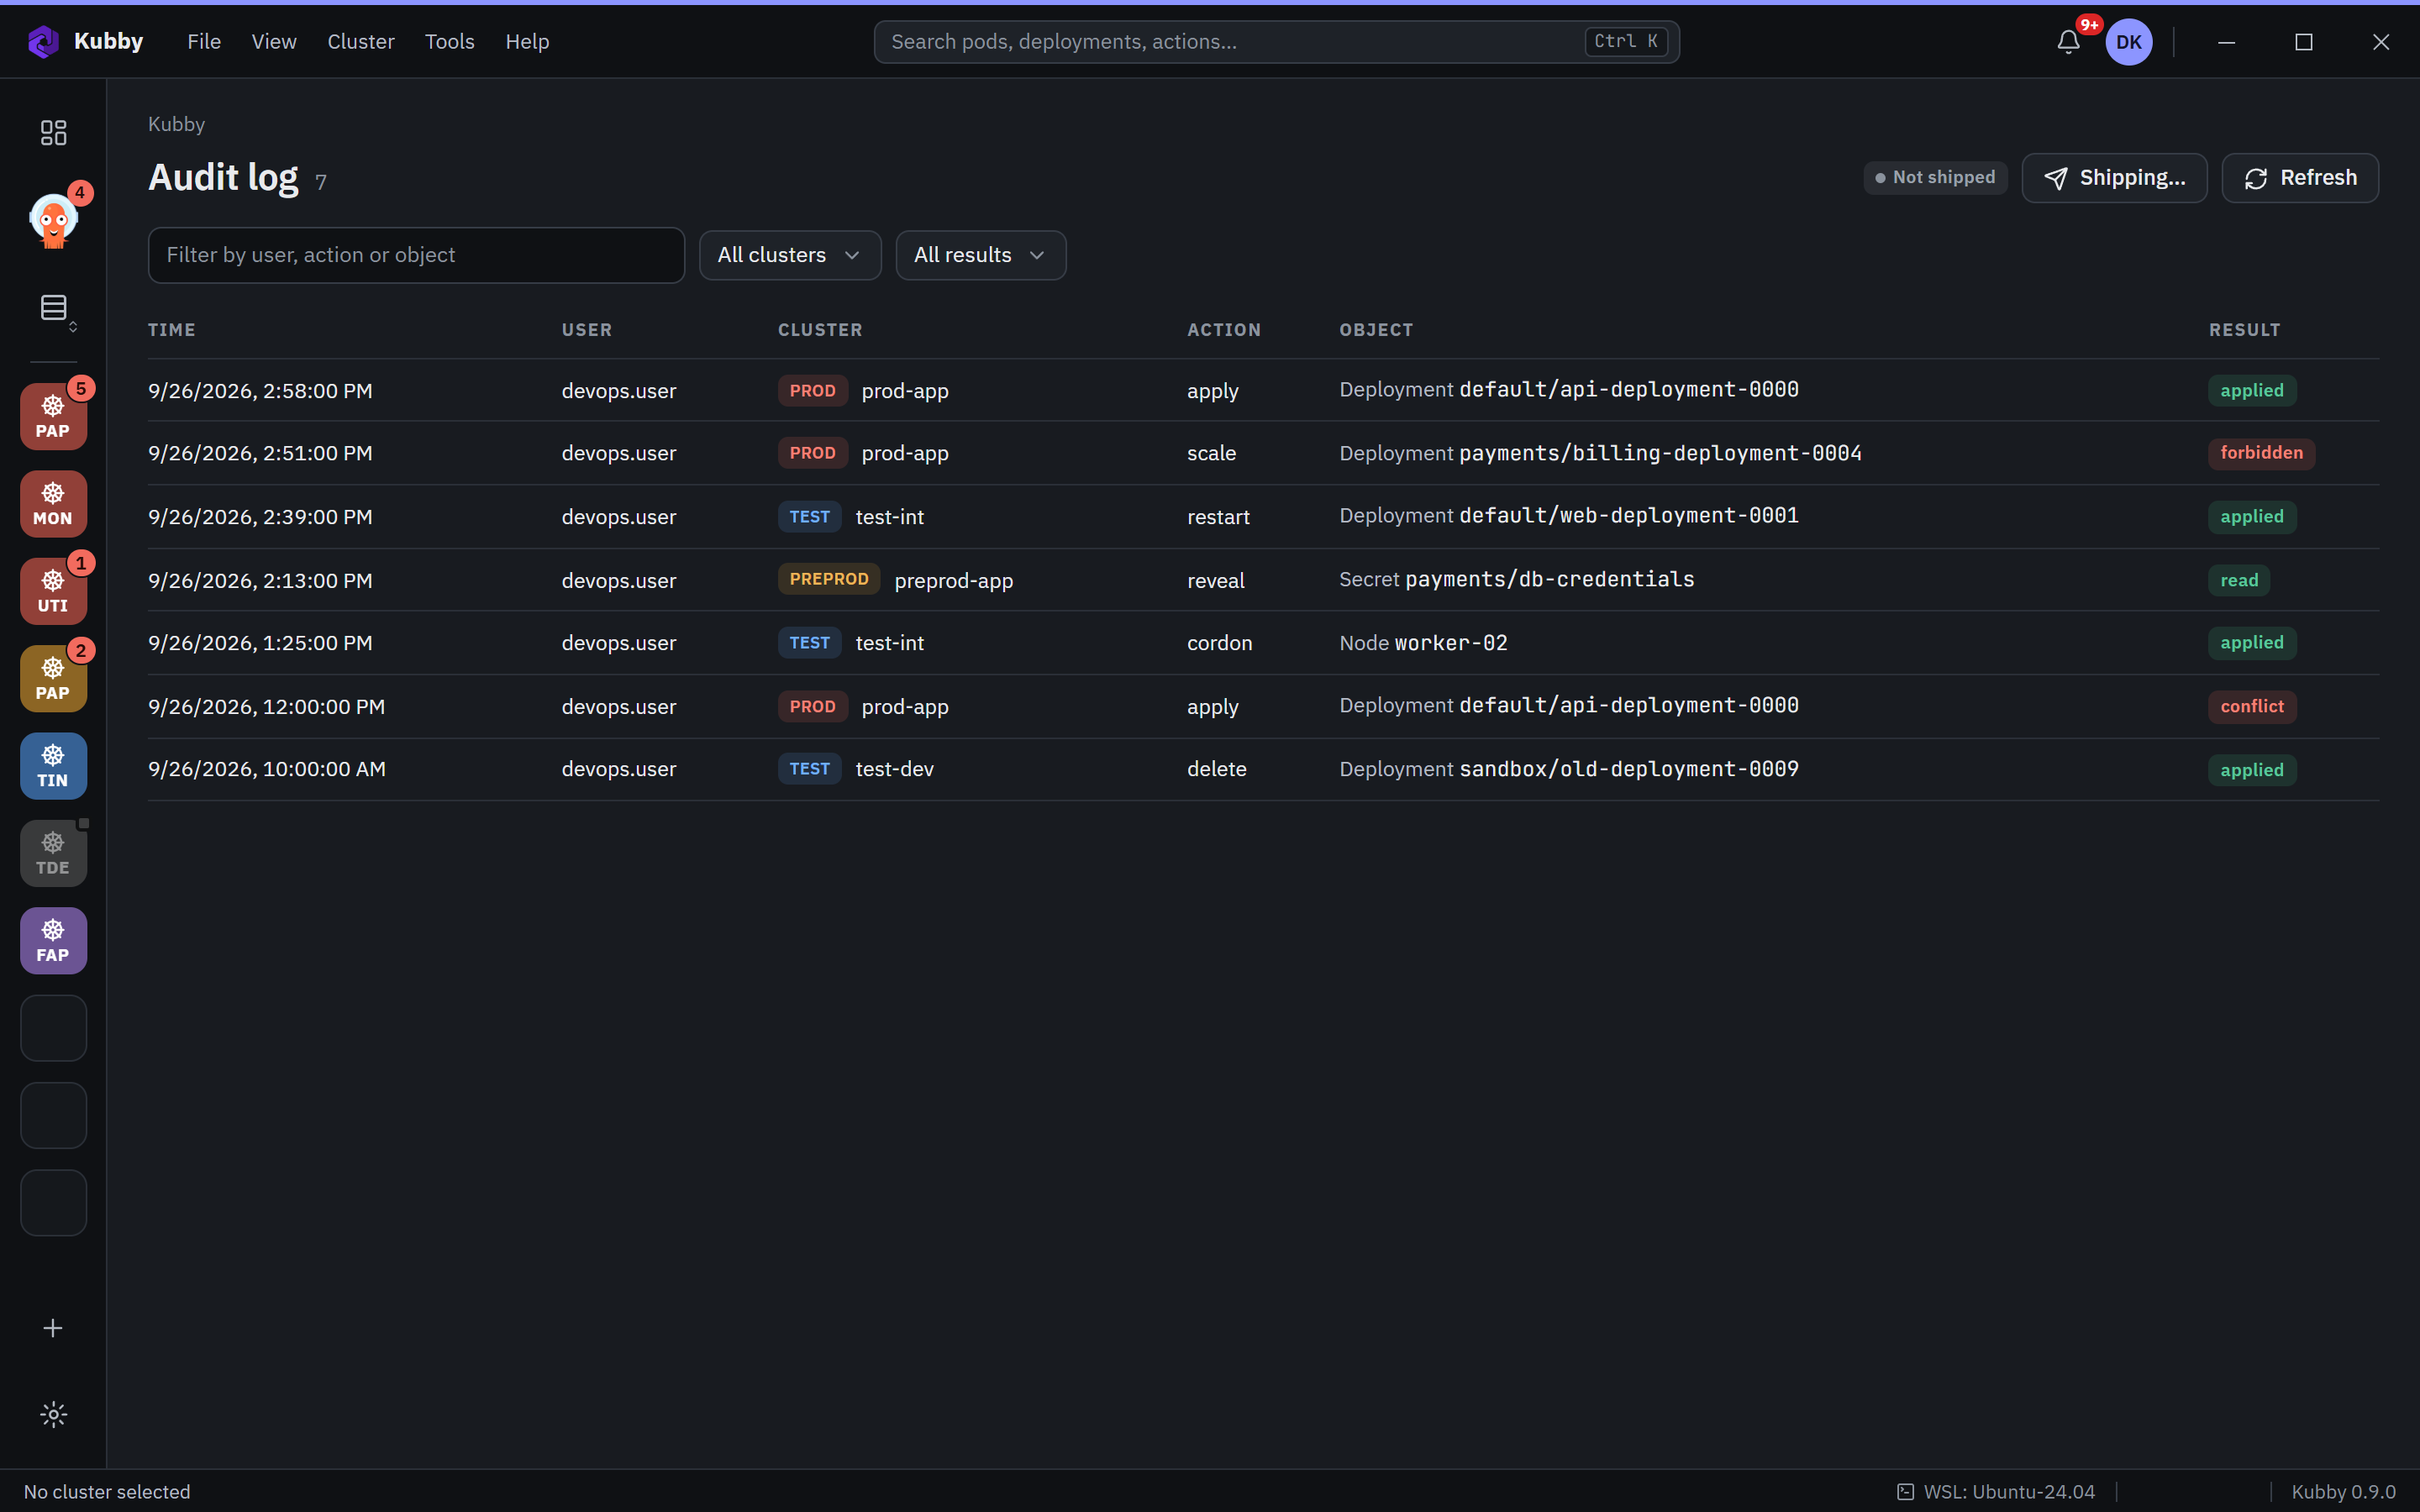
Import kubeconfigs, group clusters by environment and colour, and see which ones have problems.
Unreachable clusters say why.
Learn more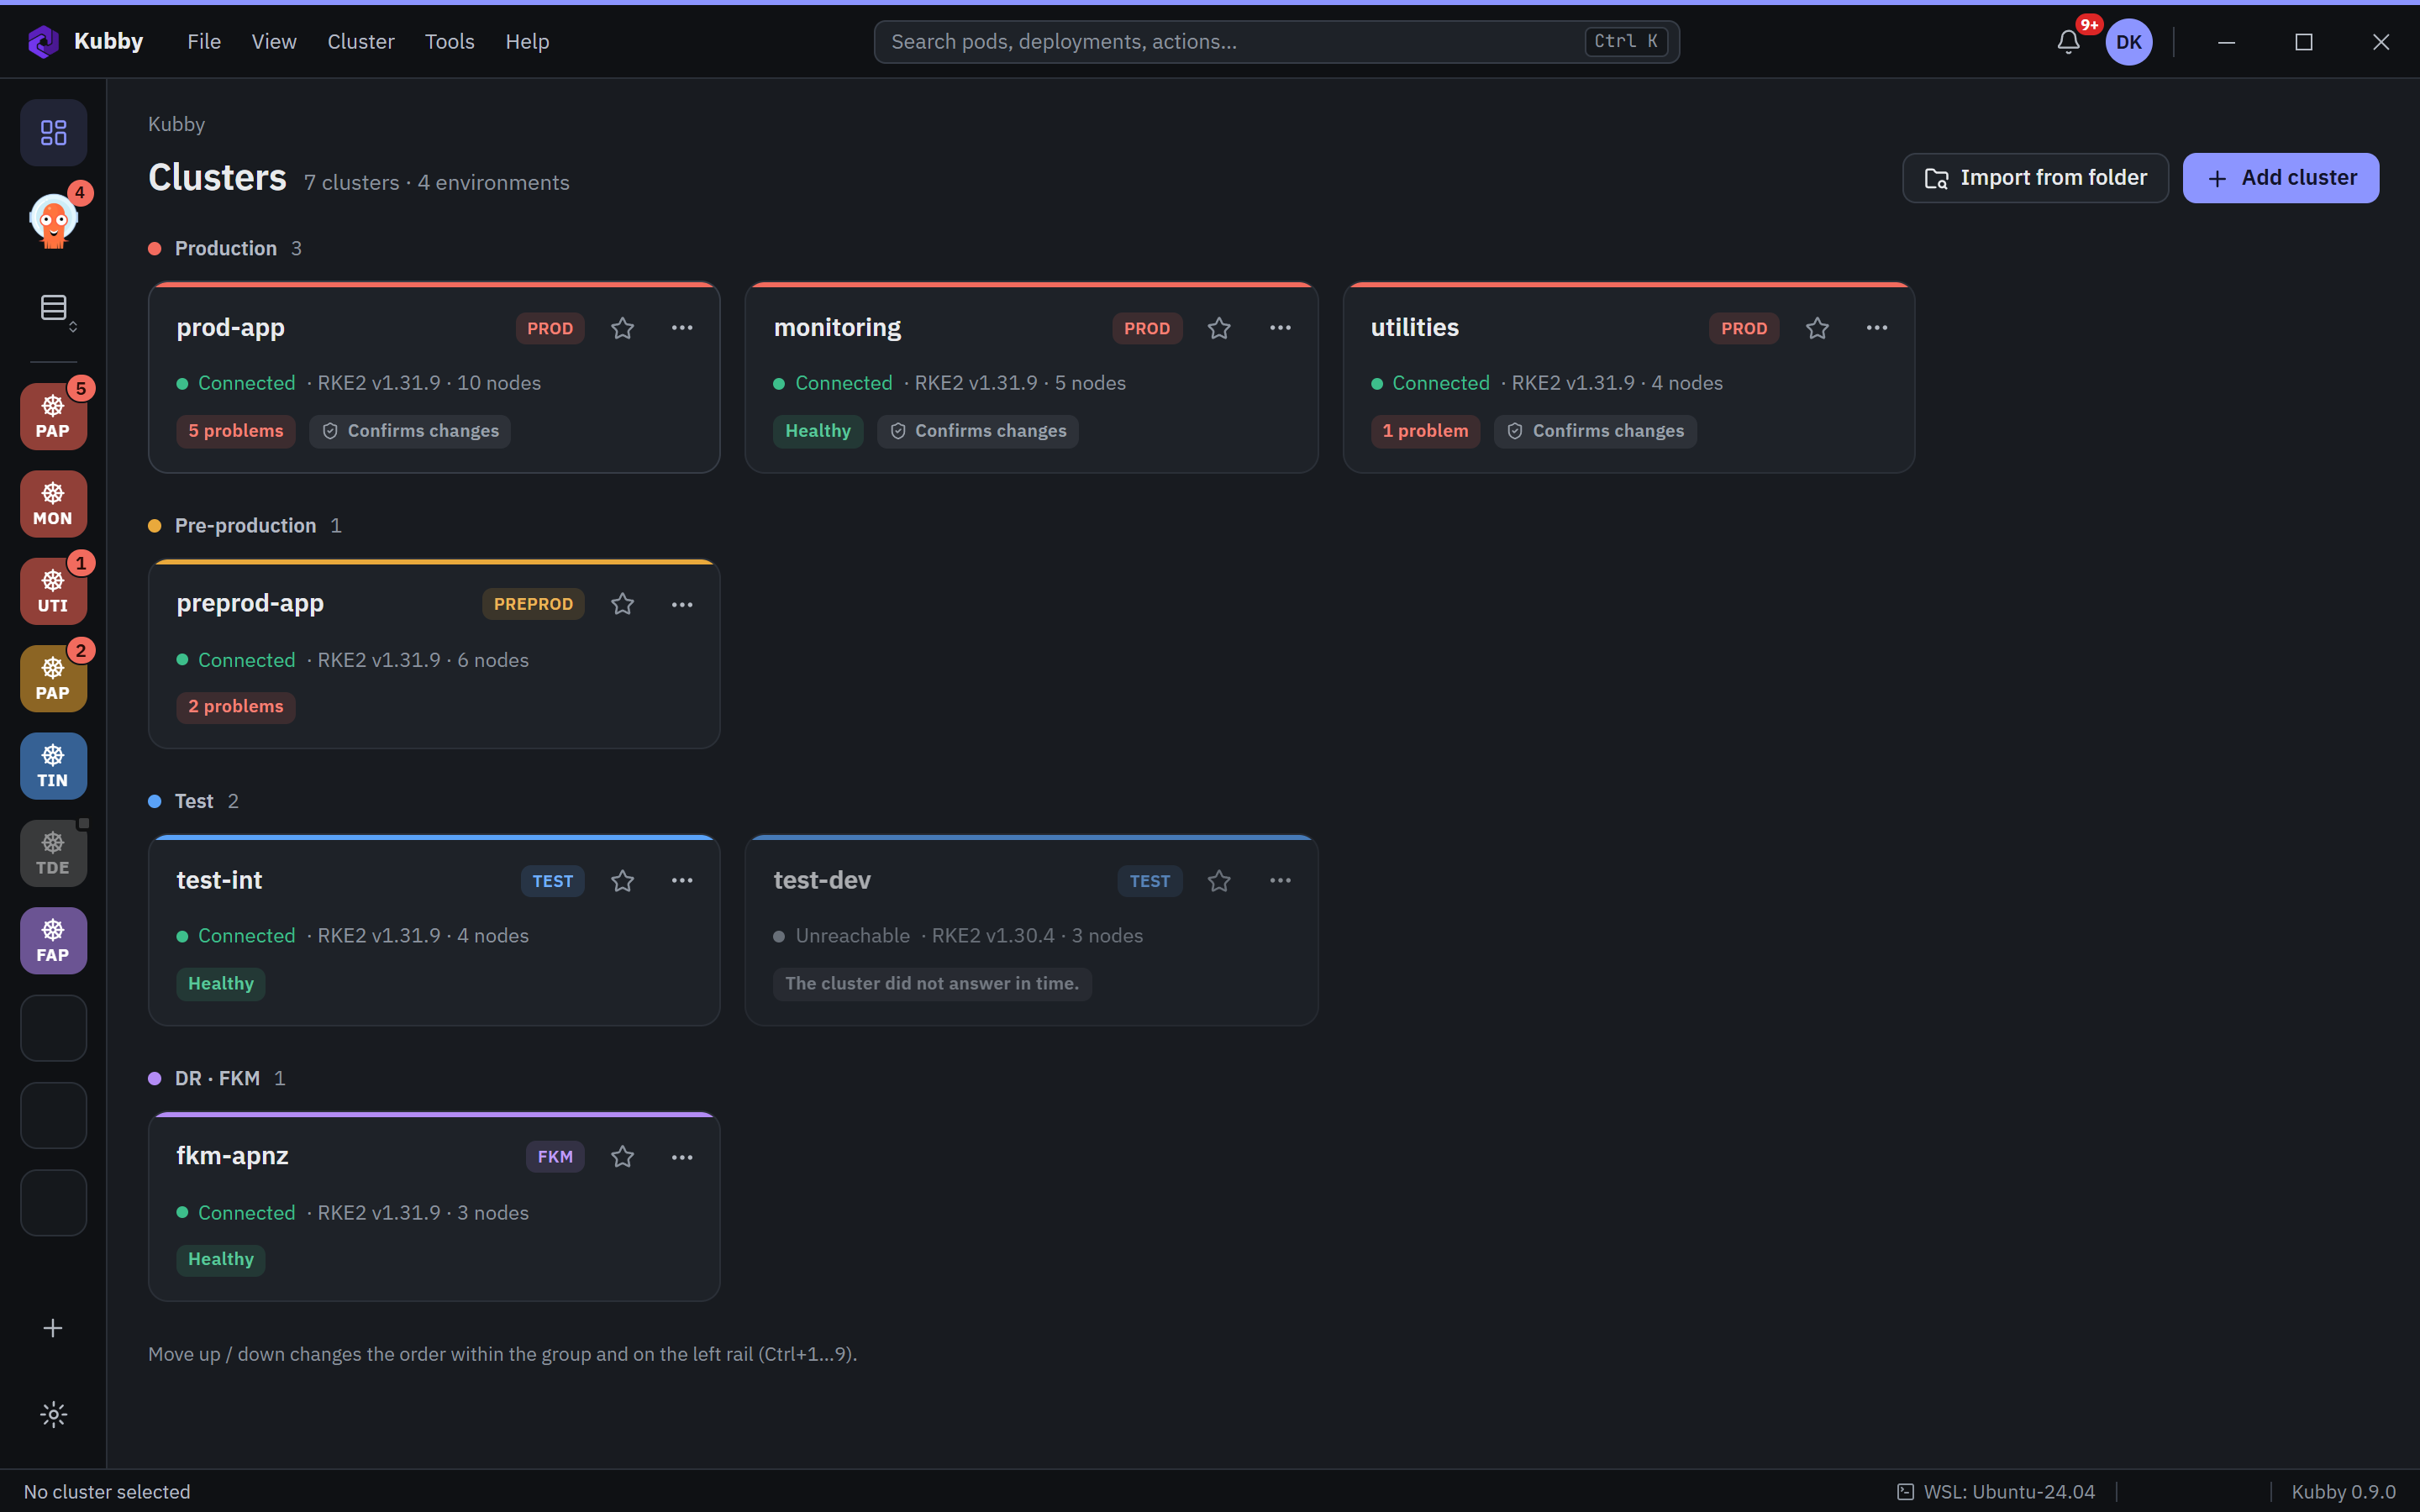
Warnings first, grouped by reason, live, with the object they belong to.
Last hour or last day in one click.
Learn more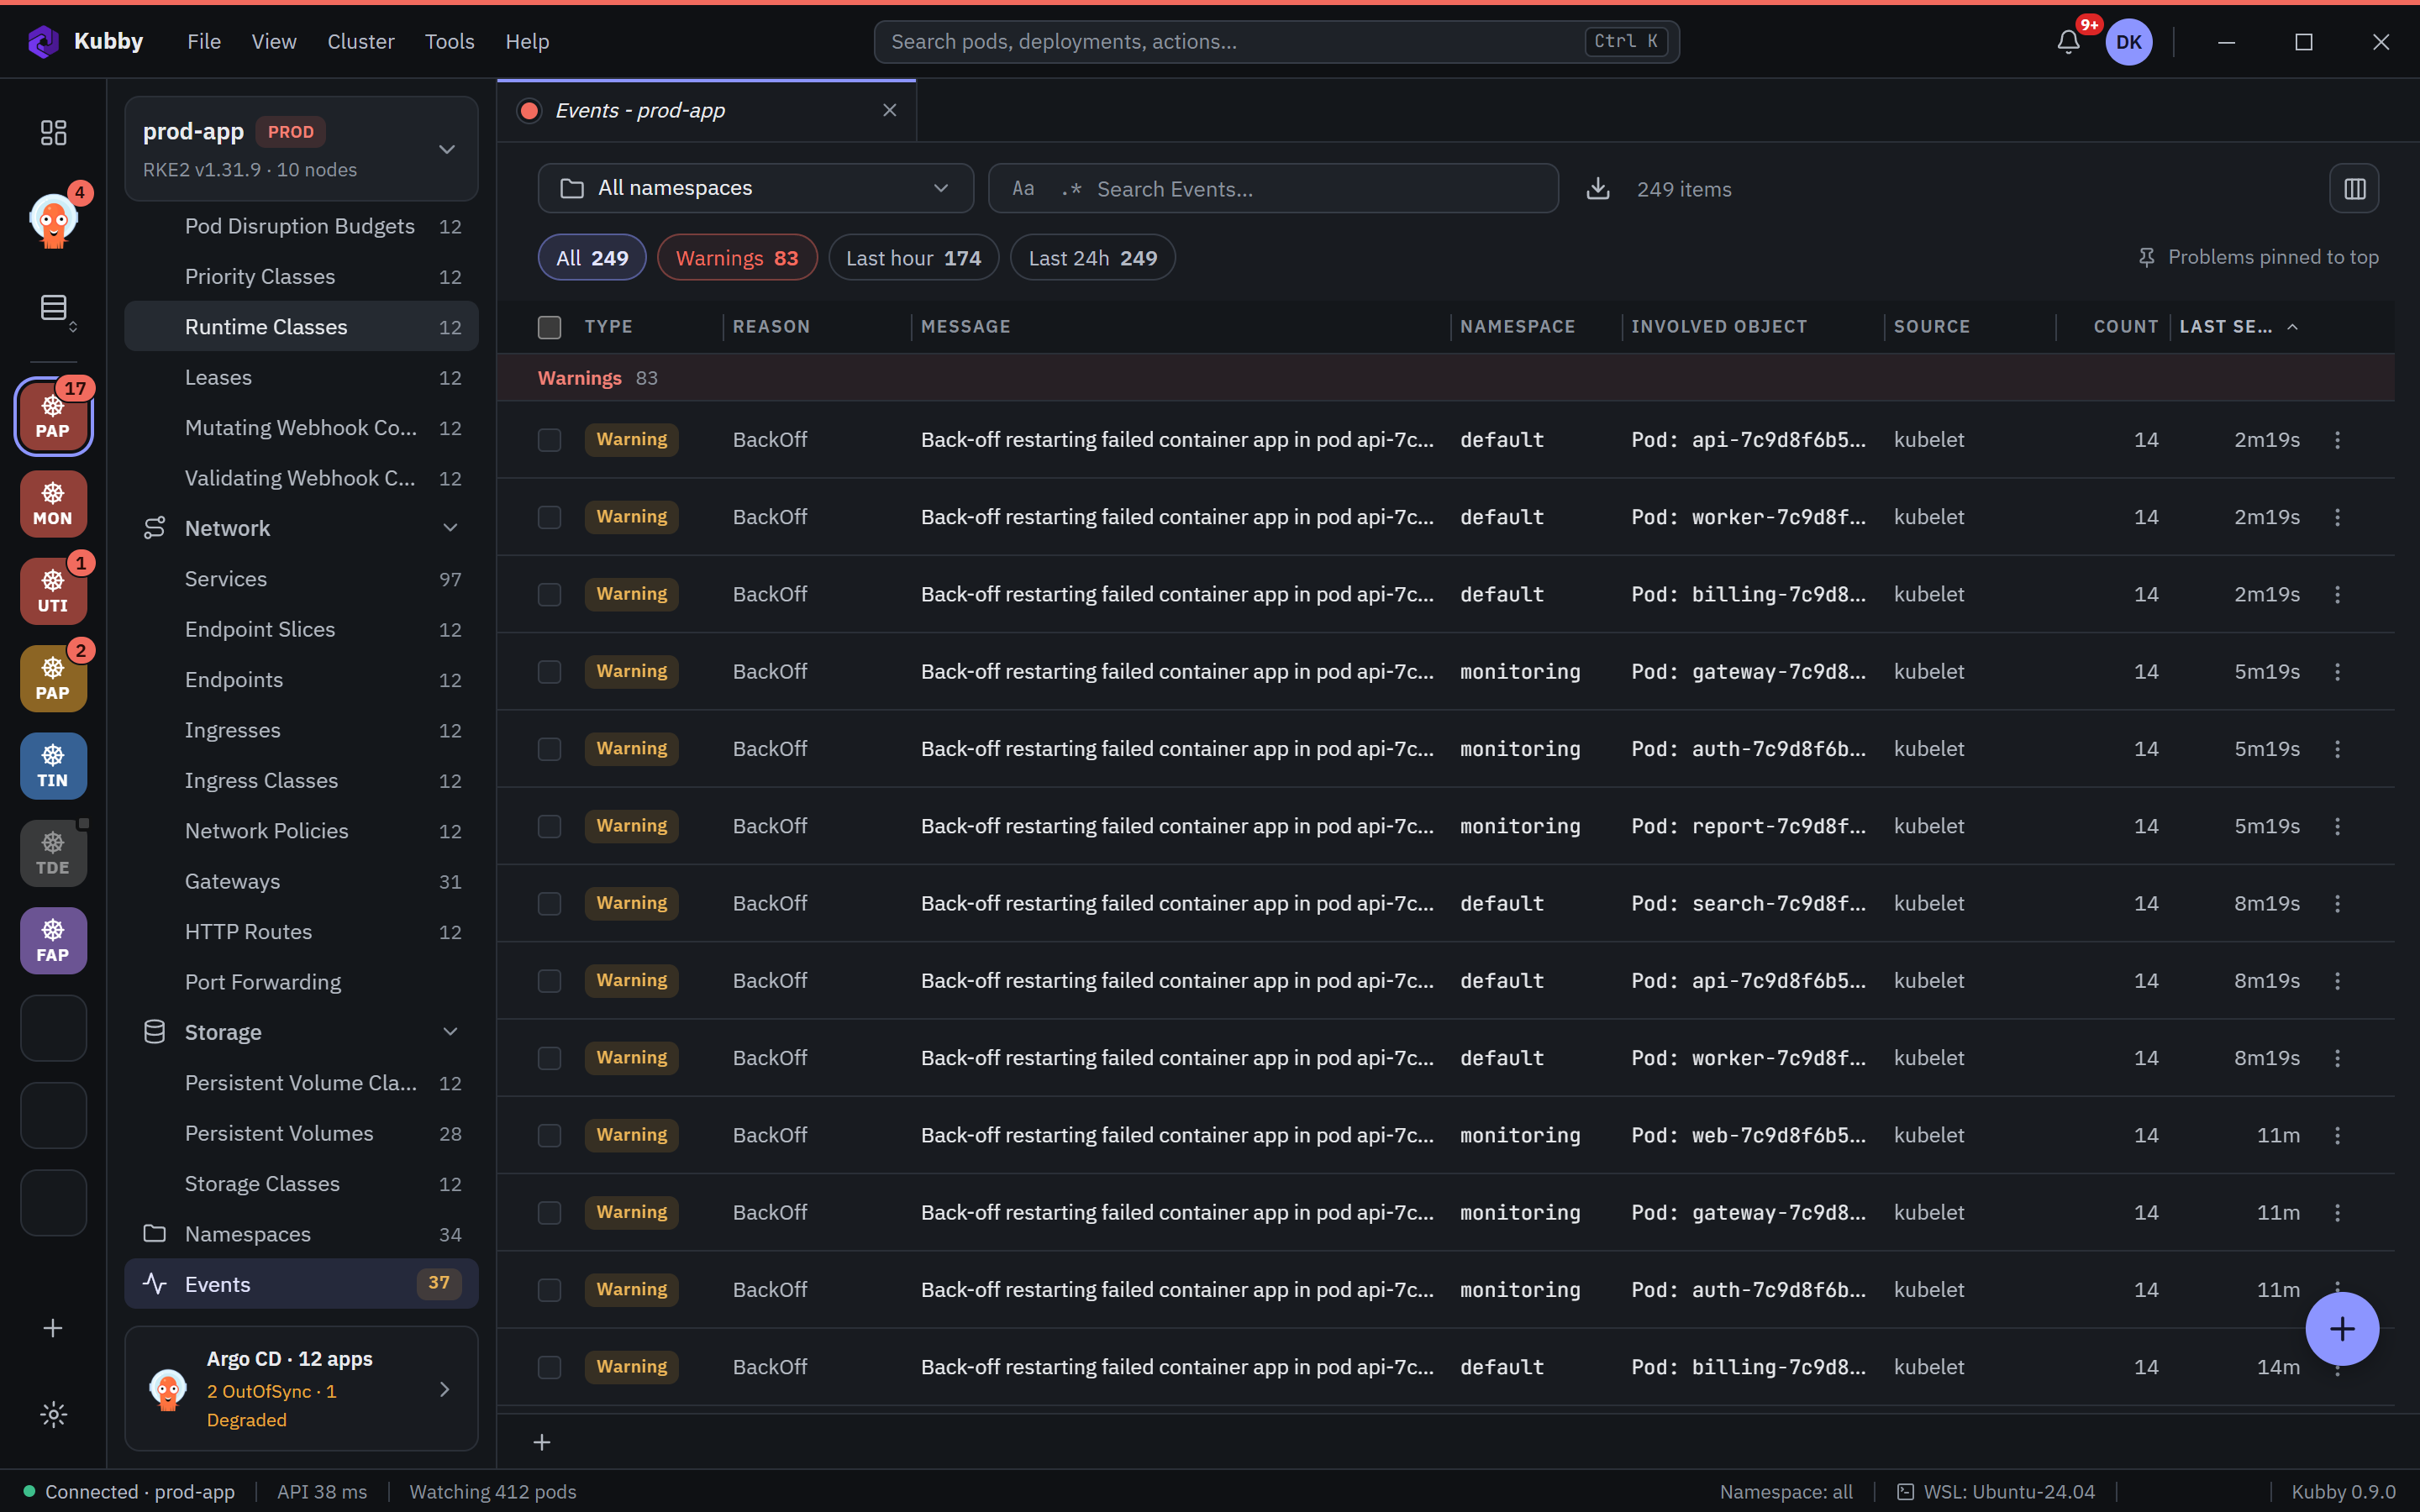
RKE2 and Rancher, k3s, kind and every distribution that speaks the standard Kubernetes API. Nothing required on the clusters: Kubby uses your kubeconfig and your RBAC.
Windows 10 and 11, 64-bit. Free, with every feature. Installs per user without administrator rights.